
 Is pork barrel spending still an important force for parties trying to shore up support for their vulnerable members? In new research which tracks earmarks across the twelve House Appropriations subcommittees in the 110th Congress, Austin Clemens, Michael Crespin, and Charles J. Finocchiaro find that the members who benefited the most from earmarking were those that sat on the committees – not the most electorally vulnerable. He writes that senior Committee members can benefit from up to 900 percent more in earmarks compared to ordinary rank and file House members.
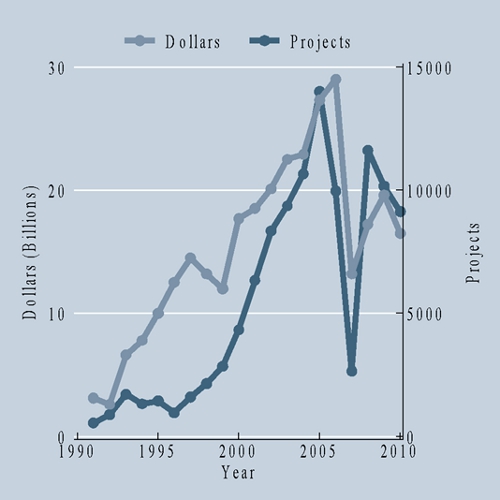
Congress has long guarded, and its members significantly value, the power of the purse. Control of the legislative aspects of U.S. fiscal affairs not only equals policy influence, but also affords election-minded members the opportunity to curry favor with constituents by directing projects and funding to the states and districts they represent. Such earmarked projects (or “congressionally directed spending”)—often characterized as “pork”—have seen a great deal of popular attention in recent years, and porkbusters like Senators John McCain (R-AZ) and Tom Coburn (R-WY) have highlighted seemingly extravagant and nonsensical projects to great effect (remember the Bridge to Nowhere?), leading Congress to reform the earmark process and, more recently, impose an outright ban on the practice. As Figure 1 shows, both the number and total dollar value of earmarks had been on the rise prior to the 2011 ban.
Figure 1 – Trends in Earmark Dollars and Projects, 1990-2010

The electoral motivations underlying pork barrel projects, and the potential for them to be used by strategic party leaders to shore up their more vulnerable members, spurred a number of studies arguing that allocation decisions were based on such considerations. This argument, while appealing in an era of polarization, goes against a generation of research that puts committees at the center of congressional spending decisions. While the majority party certainly has curtailed committee independence, in new research Austin Clemens, Michael Crespin, and I argue that recent scholarship on earmarks has understated the committee-centered nature of who wins and who loses in the earmark game.
We began our study by interviewing staffers on Capitol Hill, who told us that the locus of power was still the 12 subcommittees of the House Appropriations Committee, each of which was responsible for compiling its own spending bill. A part of that process involved members submitting earmark requests to each subcommittee. Notwithstanding both scholarly treatments and popular understanding, the majority party seems to have done little to manipulate the process to its advantage in the Congress we studied beyond one thing—maintaining what seems to be a long-term understanding that earmarks are split roughly 60/40 between the majority and minority. Interestingly, that is a ratio that shows up in a number of other important aspects of legislative organization like control of key committees.
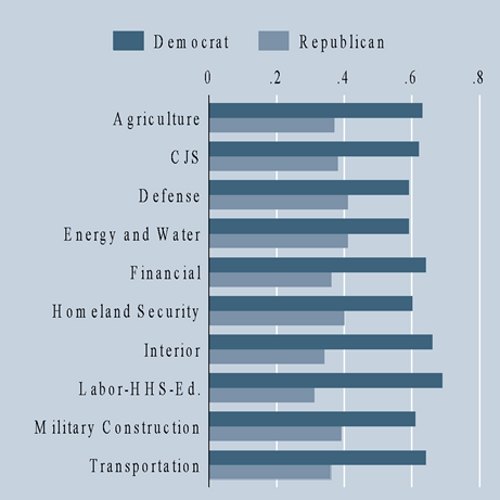
Our data bears out this pattern. As Figure 2 shows, across the ten House Appropriations subcommittees that saw significant earmark activity in the 110th Congress (2007-2008), most tracked closely to the proportionate split that staffers discussed with us. House Democrats (then in the majority) accrued, on average, about 60 percent of the earmark dollars while the minority Republicans saw about 40 percent of the funds come to them. The Defense Appropriations subcommittee distributed more than three times as much earmark funding as any other panel (more than $6 billion, about 40 percent of the total), and it fell very close to the 60/40 split overall. The partisan seat division was about 54 to 46 percent in this Congress.
Figure 2 – Partisan Division of Earmark Dollars: Percent by Party and Subcommittee

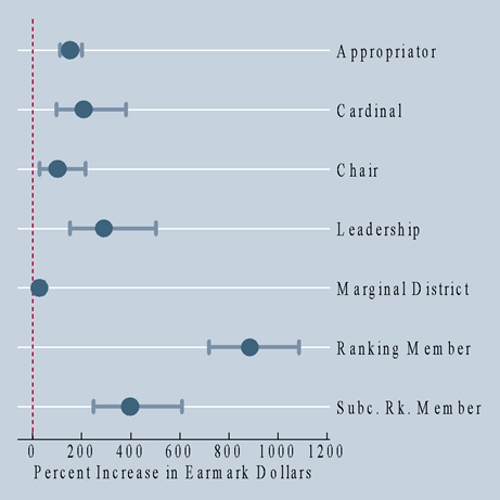
We also found that, contrary to some recent findings and popular perceptions, the members who gained the most from the earmark pie were not the most electorally-vulnerable members or even those who represented districts with the greatest demand for the types of spending embodied in particular bills. Rather, it was those same members who were responsible for doling out the pork in the first place—those who had an official seat at the appropriations table. The chair and ranking minority member of the full committee, as well as those serving in similar capacities on one of the subcommittees, benefitted the most. Rank-and-file appropriators did quite well also. Figure 3 presents the additional pork, beyond what an ordinary member of the House might expect, for members in each of these positions. The scale reflects percentage change associated with various characteristics of the legislators. The dots represent the estimate from a regression model that controls for a number of other factors as well, while the bands indicate the 95 percent confidence interval around those estimates. For instance, serving on the Appropriations Committee corresponded with about a 150 percent increase in earmark funds. Cardinals (subcommittee chairs) did slightly better. Notably David Obey of Wisconsin served both as full committee chair and a cardinal, enjoying a multiplier effect of sorts. California Republican Jerry Lewis, the ranking member of the full committee, was the most proficient—taking home nearly 900 percent more earmark funds than a rank and file House colleague.
Figure 3 – Changes in Earmarks Associated with Legislator Characteristics

In our research, we also argue that spending is best understood at the subcommittee level because that is where the key decisions are made. While the results above reflect total spending, the dominance of the committee, and the significantly less substantial effect of other factors, is even more evident. As it happens, even in an era of stark partisanship, it seems that subcommittees are still important players in the politics of spending on Capitol Hill.
This article is based on the paper, ‘Earmarks and Subcommittee Government in the U.S. Congress’, in American Politics Research.
Featured image credit: Ash Carter (Flickr, CC-BY-2.0)
Please read our comments policy before commenting.
Note: This article gives the views of the author, and not the position of USApp– American Politics and Policy, nor of the London School of Economics.
Shortened URL for this post: http://bit.ly/1GK0WyT
_________________________________
About the authors
 Austin Clemens – Washington Center for Equitable Growth
Austin Clemens is a Data and Visualizations Manager at the Washington Center for Equitable Growth. His work has been published in Legislative Studies Quarterly, Business and Politics, and the ESPN magazine.
 Michael H. Crespin – University of Oklahoma
Michael Crespin is the Associate Director of the Carl Albert Congressional Research and Studies Center and Associate Professor of Political Science at the University of Oklahoma. His research focuses on legislative politics, congressional elections, and political geography.
 Charles J. Finocchiaro – University of South Carolina
Chuck Finocchiaro is an associate professor in the Department of Political Science at the University of South Carolina. His research focuses on institutional development and organization, with a particular focus on the intersection between parties and elections in legisaltive politics. His most recent ongoing work examines the evolution of the U.S. Congress at the turn of the 20th century.


