 Despite the success of the Civil Rights movement in mostly eliminating official segregation in the 1960s, racial residential and economic segregation remains a huge problem in the US. In new research, Lindsay Fox and colleagues find that households of different races, but the same income, live in very different neighborhoods. She writes that the typical White household is in a neighborhood with a median income 40 percent higher than that of the typical Black household.
It’s certainly not news to most sociologists that racial residential segregation in the United States remains high, and that economic segregation has increased considerably in recent decades. But how do these two patterns interact in the current residential landscape? In new research, Sean Reardon, Joe Townsend, and I describe the joint patterns of racial and economic segregation using data from the decennial census and the American Community Survey (ACS). We find that households of different races, but the same income, live in neighborhoods with very different economic and racial compositions. Moreover, these patterns vary substantially across the United States. Most troubling is our finding that Black and Hispanic households tend to live in much poorer neighborhoods than White households with the same income.
Our findings won’t be new to those who have read the work of Mary Patillo, Doug Massey, John Logan, and many other scholars of racial and socioeconomic segregation. However, we developed a new and more precise method of summarizing patterns of neighborhood composition using Census and ACS data. As a result, we are able to describe and compare the average racial and economic composition of the neighborhoods of each racial/ethnic group at each exact level of household income. This allows us to make detailed comparisons across metropolitan areas and races, and show that the patterns hold for all levels of income.
In Figure 1 below, each line describes the median neighborhood income for the typical household of a particular race/ethnicity at any given income level. On the x-axis is the household’s own income and on the y-axis is the median income in its neighborhood (specifically, its census tract). The median Black household in the U.S. (the circle on the red line) has an income of roughly $35,000 and typically lives in a neighborhood with a median income of about $38,500. The median White household (the circle on the blue line) has an income of roughly $59,000 and typically lives in a neighborhood with a median income of $54,000. That is, the typical White household is in a neighborhood with a median income 40 percent higher (or roughly $15,500 higher) than that of the typical Black household.
Figure 1 – Neighborhood Median Income by Household Income and Race, all US Households, 2009
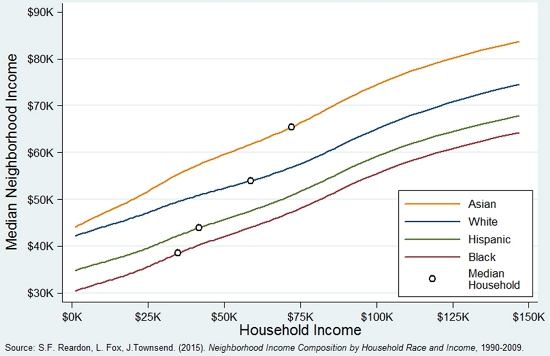
This difference is perhaps not surprising, given that Black households have lower incomes than White households on average. More striking, however, is that most of the difference remains even when comparing Black and White households with the same income. The average spread between the red and blue lines is about $10,500, meaning that two-thirds of the $15,500 Black-White neighborhood income gap is not accounted for by Black-White differences in household income. Similarly, two-thirds of the $10,000 White-Hispanic difference in neighborhood median incomes remains when comparing households of the same income.
Another implication of this figure is that poor Whites typically live in richer neighborhoods than middle-income Blacks and Hispanics. The average White household with an annual household income of just $25,000 lives in a neighborhood where the median income is $47,000 – higher than in the neighborhoods of the typical middle-income Black and Hispanic households earning $50,000/year.
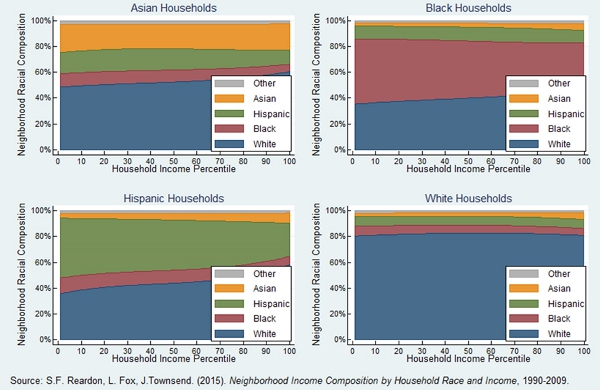
Patterns of differences in neighborhood racial composition are equally striking. Figure 2 below provides an illustration of the degree of racial segregation even among households with the same incomes. For example, regardless of their income, White households live, on average, in neighborhoods that are 80 percent White (see the lower-right panel of the figure), while Black and Hispanic households generally live in neighborhoods that are roughly 35 percent-50 percent White. The figure makes clear that the racial composition of one’s neighbors depends much more on one’s race than on one’s income. So while racial residential segregation has been decreasing over the past few decades, it still remains high and very little of it can be explained by racial differences in income levels.
Figure 2 – Average Neighborhood Racial Composition by Household Income and Race, all US Households, 2009
The figures above reflect national trends, but these disparities also vary considerably by place. We looked within metropolitan areas and found wide variation in neighborhood gaps by race and income. As the table below shows, the Milwaukee and Newark metros have the largest Black-White neighborhood gaps. On average, White middle-income households in those metros live in neighborhoods where the median income is 1.8 times higher than Black households of similar incomes – and that ratio doesn’t change much at different income levels. Most of the other metro areas with large Black-White neighborhood disparities are in New England, New York, and Pennsylvania.
Table 1 – White-Black Differences in Neighborhood Median Income for Households Earning $50,000, by Metropolitan Area, 2009
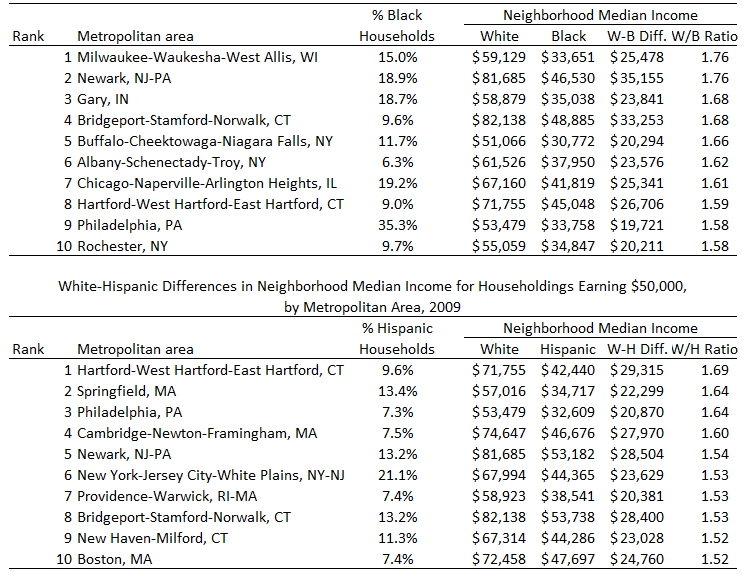
Credit: Source: S. F. Reardon, L. Fox, J. Townsend. (2015) Neighborhood Income Composition by Household Race and Income, 1990-2009.
Likewise, all of the 10 metropolitan areas with the largest White-Hispanic neighborhood income gaps are in New England, New York, and Pennsylvania. The Hartford, CT metropolitan area has the largest White-Hispanic disparity. There, White households making $50,000 typically live in neighborhoods where the median income is 1.7 times higher than Hispanic households making $50,000. These disparities exist in most metropolitan areas, but in a few, there is little or no difference in median neighborhood income between households of different races/ethnicities but the same income. These are largely places with small minority populations and low levels of racial segregation.
What drives these patterns? An extensive existing body of research suggests a number of causes: racial differences in wealth and assets, continued discrimination in the housing market, residential preferences (which are themselves partly a legacy of past racial hostility and discrimination), and the location of affordable and subsidized housing. Each of these has been shown to contribute to patterns of racial segregation, net of income differences.
Should we worry about these patterns? If we are concerned about equality of opportunity, the answer is yes. Considerable evidence, including new evidence from the Moving to Opportunity (MTO) program, shows that growing up in a poor neighborhood does lasting harm to children’s opportunity for success. Poor neighborhoods are more likely than middle-class neighborhoods to have lower-quality schools and child-care centers, higher rates of crime and violence, and less access to healthy food. In the MTO study, moving to a neighborhood with a 20 percentage point lower poverty rate led, on average, to 31 percent higher earnings, a 33 percent increase in college going, and a substantial decrease in single motherhood.
Consequently, the large racial differences in neighborhood conditions we and others have described mean that Black and Hispanic children face a double disadvantage – not only do their families have, on average, fewer economic resources than White children, but their neighborhoods are more disadvantaged as well. Segregation—particularly the racial disparities in neighborhood economic conditions—is therefore an agent of unequal opportunity.
This article originally appeared at Contexts, and is based on the paper, ‘Neighborhood Income Composition by Household Race and Income, 1990–2009’, in The Annals of the American Academy of Political and Social Science.
Featured image credit: Images Money (Flickr, CC-BY-2.0)
Please read our comments policy before commenting.
Note: This article gives the views of the author, and not the position of USApp– American Politics and Policy, nor of the London School of Economics.
Shortened URL for this post: http://bit.ly/1K16uSY
_________________________________
Lindsay Fox – Stanford University
Lindsay Fox is a doctoral candidate in the Economics of Education program and an Institute of Education Sciences fellow at Stanford University’s Center for Education Policy Analysis. Her research interests include teacher contributions to student learning, teacher labor markets, income inequality, and methods for causal inference.