 Despite talk of collapsed Democrat support for Clinton, her performance in urban areas was very strong this presidential election. As Joshua D. Ambrosius argues however, her loss to Donald Trump highlights the weakness of Democrats’ urban-centric appeal, given the new-found GOP capacity to mobilise masses of rural working class and suburban Americans.
Democratic presidential nominee Hillary Clinton’s lead in the popular vote has exceeded 1.7 million and is likely to grow some more before all ballots are counted. The Republican nominee Donald Trump, nonetheless, won (or is expected to win) the Electoral College 306-232. Trump has assumed the mantle of president-elect, but had Clinton won just 107,000 more votes divided sufficiently across Pennsylvania, Wisconsin, and Michigan, we would be welcoming our first Madame President.
The state-level maps show a few blue, largely urban areas floating in a sea of red rural and suburban counties. Given the close election, one might wonder whether a lackluster performance in the Democrat’s urban strongholds could be to blame for the rupturing of the so-called “blue wall” stretching across the Rustbelt. Did Hillary Clinton underperform in urban areas relative to Barack Obama? Or, alternatively, did Donald Trump make headway into the Democrat’s dominance of the urban vote?
The short answer is no—Clinton held Trump to the same number of urban victories and even chipped away slightly at the GOP share of urban votes. Some media outlets have been exploring the urban, suburban, and rural divide—noting that Clinton won nearly all of the big urban cores, but lost 75-90% of other types of counties by an average margin of 50 points or more. In most states that switched, it was likely due to an uptick in white working class voters outside cities—but each state is unique, calling into question grand narratives. There were, however, some instances of lower urban turnout in the several Rustbelt states that decided this election.
*
My curiosity about Clinton’s urban performance is both rooted in my current local context and also my previous research on the past four presidential elections. I work at the University of Dayton in Montgomery County, Ohio. Our county—which contains the city of Dayton—voted for the Republican candidate for President for the first time since 1988. As someone who has previously researched the voting patterns of “core counties” like Montgomery County, I wanted to know whether this local shift was indicative of a larger national trend.
There are many ways to look at the “urban electorate.” My strategy builds on published research on the past four elections analyzing returns in 92 “core counties” of metro areas over 250,000 people. These are the counties containing central cities—with the largest population center representing combined metropolitan areas where two are adjacent. My choices in selecting these counties are debatable, but I am keeping the lot consistent to compare across five presidential elections. These counties are diverse—with variations in minority populations and the degree to which suburbanites are lumped in with central city residents. Taken together, they represent about 27% of the national two-party votes in the two Obama elections as well as the current Trump election. A previous post on this blog summarized that work and its implications for 2016.
To compare the performances of Obama and Clinton, I made the following observations about how these core counties voted previously and currently:
- George W. Bush was able to carry a majority of two-party votes in 39 of these counties in both the 2000 and 2004 elections. Obama held McCain to just 18 and Romney to 21. Trump also won 21.
- Bush won about 43% of the votes in these counties during both his elections. McCain and Romney won about 38%. (Thus, Obama cut the GOP’s share of the urban vote by about 5 points.) Clinton held Trump to less than 37% of the vote here.
Figure 1 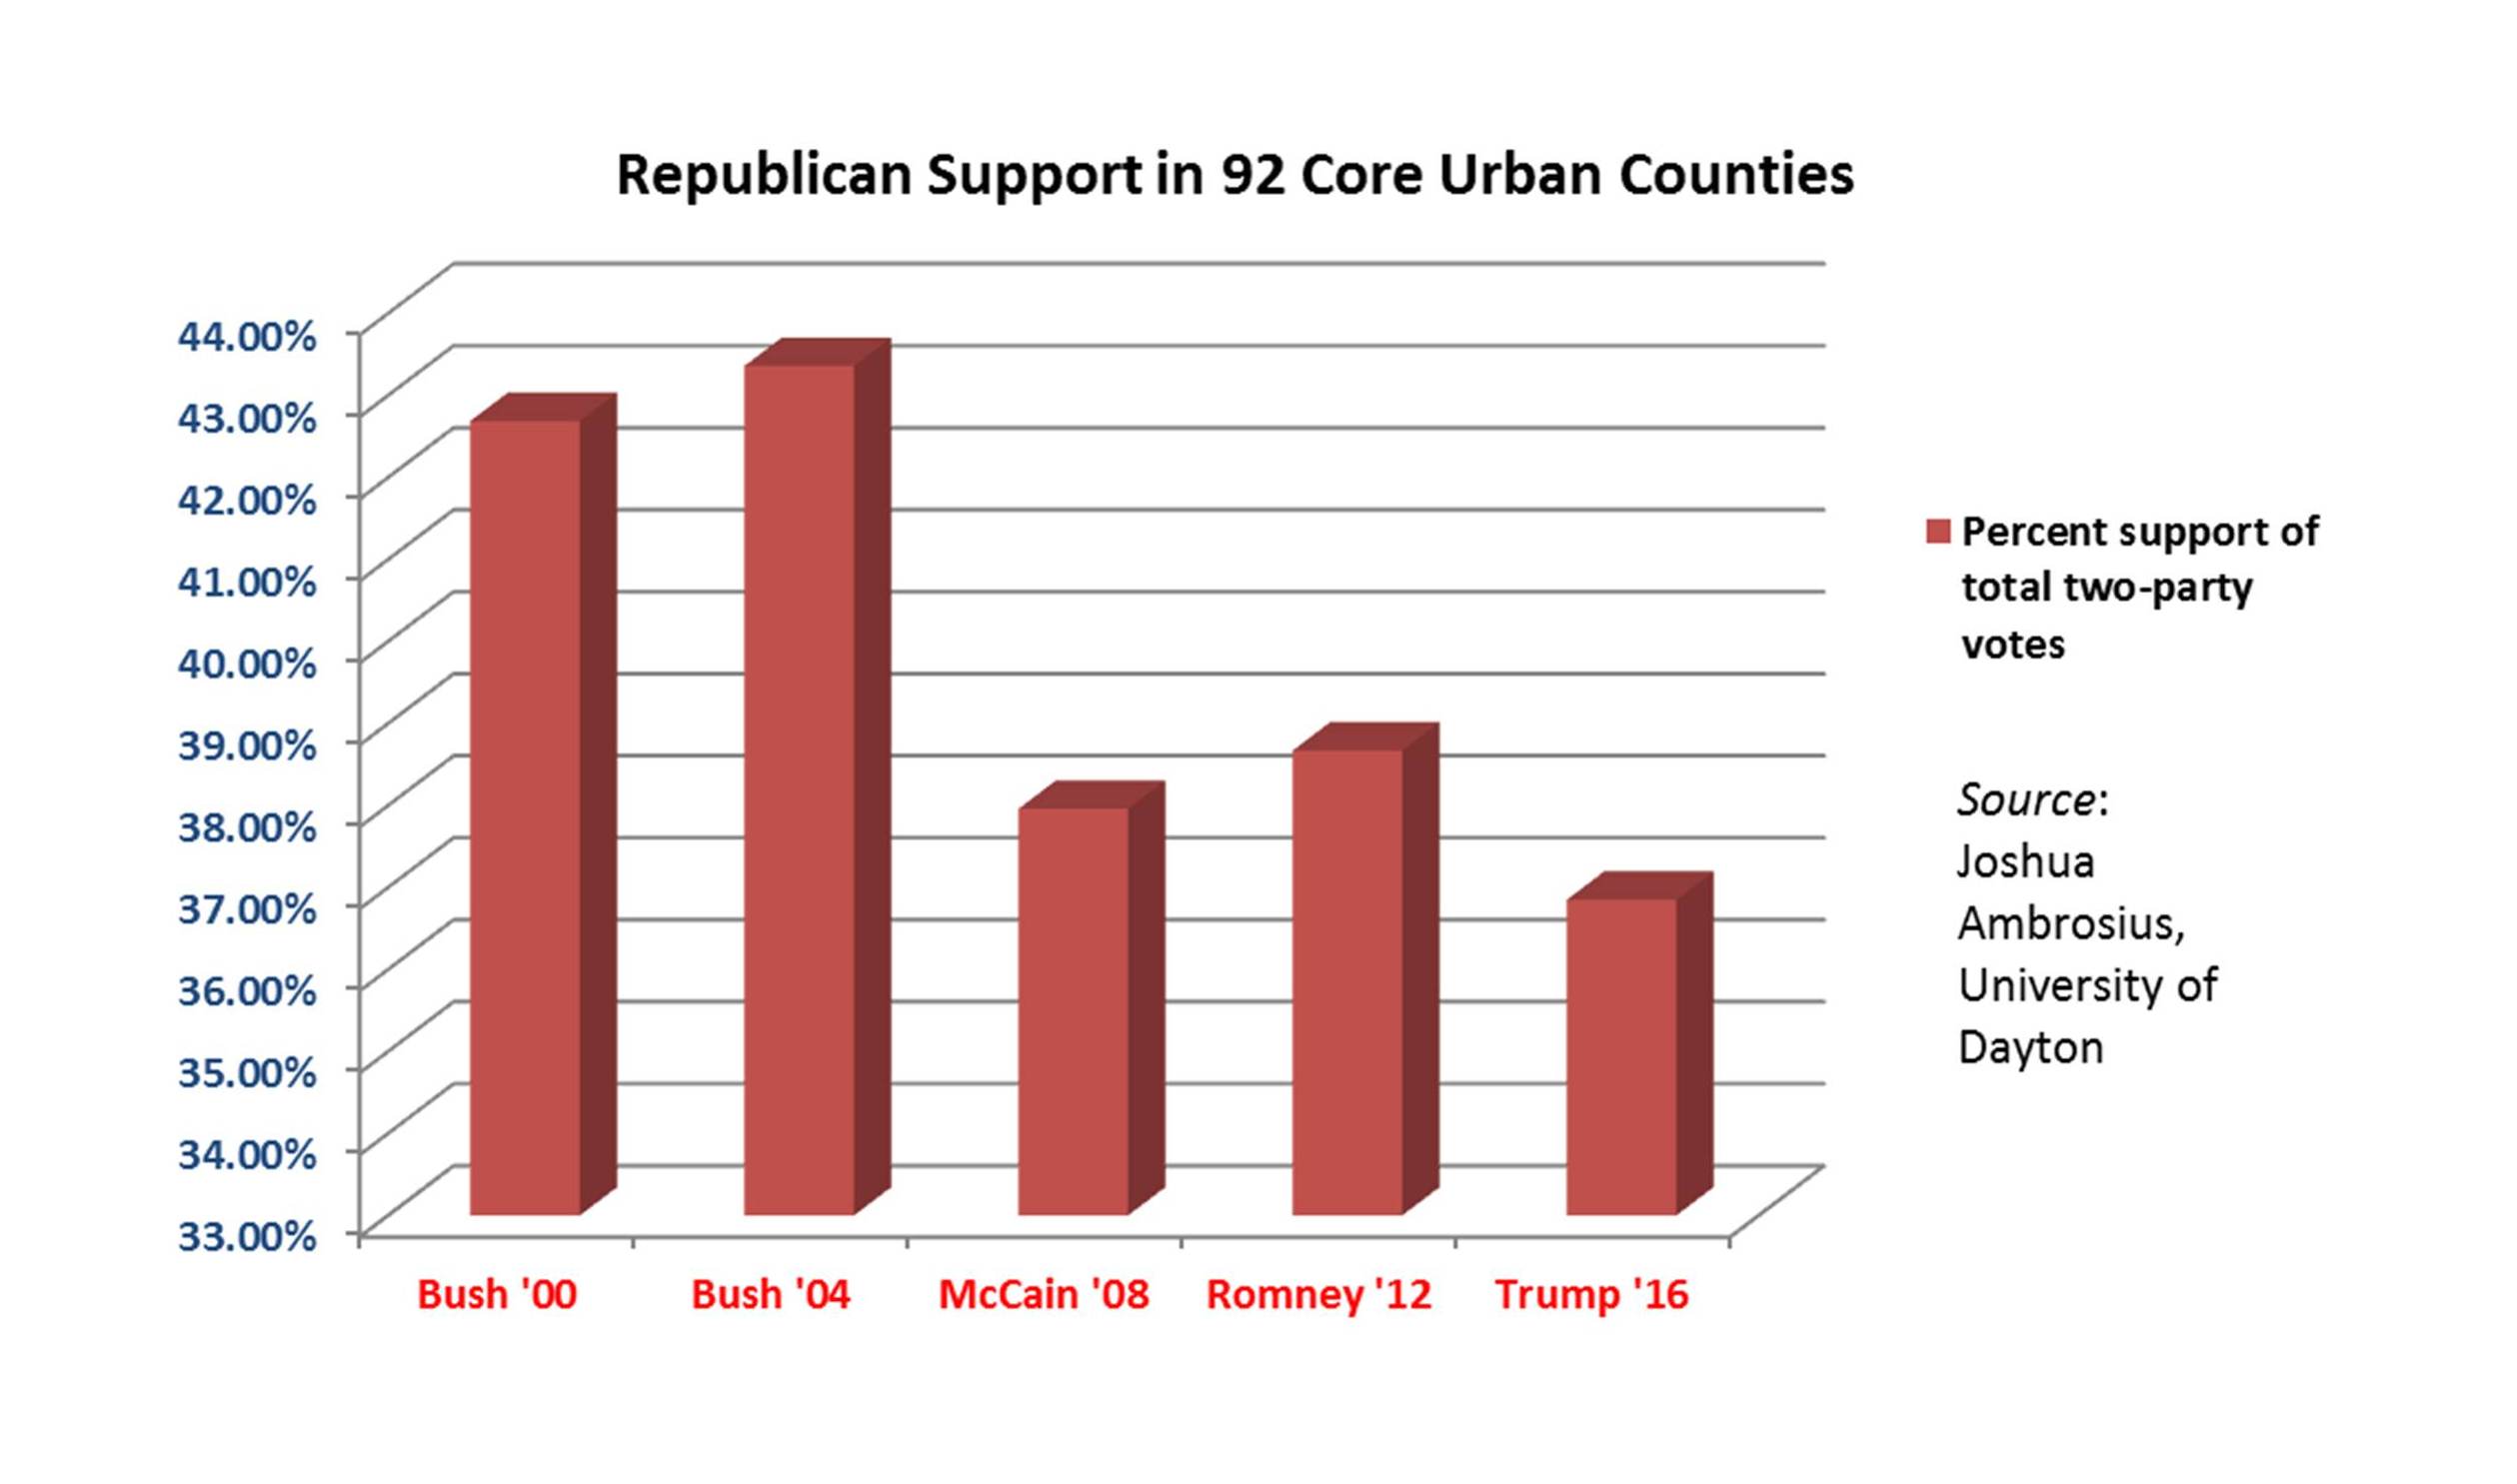
- Romney carried his 21 core counties with an average of 57% of the vote and by 13.5 points on average. In comparison, Trump carried his 21 counties with an average of 56% of the vote and by 12 points.
- On the flip side, Obama won his core counties with 58% average support and by 26 points on average. Clinton won hers with nearly 60% average support and by almost 29 points.
- Romney’s core counties had average unemployment rates for September before the election (the last released) of 7.3%. Obama’s counties were at 7.9%. The unemployment rates for September were nearly identical for both Clinton and Trump’s core counties—red counties at 4.7%, blue at 4.8%.
- The percent of the labor force employed in manufacturing was moderately associated with variation in support for Trump. The upper half of counties ranked by Trump support had 2010 manufacturing proportions about 1.2 percentage points higher on average than the lower half. However, these same patterns were evident in the 2012 election.
- Statistical models of support for Trump show that the impact of socio-demographic factors (including race, age, and education) had moderately less impact this election relative to 2012 and before. Cultural indicators rose slightly in importance (including proportions of evangelicals, veterans, and same-sex households—you can guess the directions of the effects). Economic factors like unemployment and the manufacturing economy had even less impact in these core counties this election.
Trump was able to win over, for examples, the home counties of Dayton; Poughkeepsie, New York; and Tampa, Florida. But he lost, from Romney, the counties with Salt Lake City, Utah; Mobile, Alabama; and Fresno, California. As with the 2008-2012 elections, the GOP candidate traded several smaller or midsized core counties but was unable to make inroads in the larger urban cores. The GOP hung onto most of its southern and heartland core counties in red states—those containing Jacksonville, Florida; Wichita, Kansas; and Tulsa, Oklahoma, for examples.
Clinton did underperform in turnout—rather than percentage of support—in a few Rustbelt cities. Democratic numbers were down in Milwaukee County, Wisconsin, by about 39,000 votes. But Trump was also under Romney here by 32,000. This 7,000 vote gap did contribute to Clinton’s statewide loss by a mere 27,000 votes. Wayne County (Detroit) experienced a much larger decline of 81,000 votes while Trump surged with an additional 12,000. Michigan was decided by just 11,000 votes. Nonetheless, I see these as campaigning failures more than signs of any nationwide trend. Most other core counties, even elsewhere in the Rustbelt, saw more Democratic voters turning up to support Clinton.
*
Given the crux of this analysis, I stand by my original conclusions from my previous post. Identity politics, based on socio-demographic and cultural factors, are alive and well—and significantly shaped the small amount of support earned by the GOP candidate in core counties. As I noted, “The urban electorate is identifying less and less with the Republican Party.” This does appear to be a societal trend that will withstand the loss of President Obama’s urban appeal. I further wrote: “Whatever the reason, the GOP must compensate for this [urban] deficiency or risk losing future elections by even greater margins in urban areas. It will require softening their platform’s stances on social welfare policy, immigration reform, and same-sex marriage and diversifying the top of the ticket.” The GOP under president-elect Trump does not appear to be taking any of this advice—but they might not need to with their massive white working-class, rural, and suburban support.
Will this trend of increasing urban support for the Democrats continue into 2020? Probably. In his middle-of-the-night victory speech, Donald Trump promised that, “We are going to fix our inner cities.” We must wait to see how much he intends to make good on this promise. His temperament suggests he will reward his supporters and exact vengeance on his opponents and critics. On the other hand, his desire to succeed for “all Americans” may temper his base nature. One type of city that Trump will likely strike back at quickly is the “sanctuary city” which does not enforce federal immigration law when arresting undocumented immigrants for lower-level crimes. These include Philadelphia, Seattle, and Dayton, Ohio.
Could the policies of the Trump Administration actually “fix” the problems of America’s cities? However unlikely, significant improvement in urban living and economic conditions could help stall the trend of increasing urban support for Democrats. One vocal Trump supporter, Black Protestant minister Darrell Scott, believes that—as a developer—Trump will make good on these promises and draw significant inner-city and African American support away from the Democrats, should he choose to run again in 2020. I will revisit in four years.
All this being said, the Democrats—said to be destined to dominate American politics due to demographic shifts — really, really need to expand their appeal outside of urban centers. If the next few presidential elections look anything like this one, they will (a) be very, very close and (b) require more than just urban support to win back the White House for the Democrats. One thing is for sure right now: the United States will have its second consecutive urban president come January, albeit a very different one who lost the support of his home city of New York. We’ve gone from Community Organizer-in-Chief to Urban Developer-in-Chief.
Featured image credit: Michael Hogan (Flickr, CC-BY-NC-SA-2.0)
Please read our comments policy before commenting.
Note: This article gives the views of the author, and not the position of USApp– American Politics and Policy, nor of the London School of Economics.
Shortened URL for this post: http://bit.ly/2gG2QMi
_________________________________
About the author
Joshua D. Ambrosius – University of Dayton
Joshua Ambrosius is an Assistant Professor in the Department of Political Science and Master of Public Administration Program at the University of Dayton in Dayton, Ohio. His research interests include urban and housing policy, regional governance, and religious organizations. His academic work has appeared in such journals as Journal of Urban Affairs, Housing Policy Debate, American Review of Public Administration, Journal of Urbanism, and Local Environment.