In 2016 Donald Trump surprised much of the political world by winning the Electoral College – and the White House. Jack Thompson reminds us that Trump’s strategy was to tear down the Democrats’ ‘Blue Wall’ of Pennsylvania, Wisconsin and Michigan by appealing to working class whites in those Rust Belt states. Looking to 2020, he writes, Trump will be aiming to do the same, a goal which might be made more challenging if he faces former Vice President Joe Biden in the General Election.
Without winning the states of Michigan, Ohio, Pennsylvania, and Wisconsin, Donald Trump would not be President today. These Upper Midwestern states form a region colloquially known as the Rust Belt. Once the centre of America’s industrial might, from the 1970s onwards, the closure of steel mills in cities like Youngstown, Ohio heralded deindustrialisation and population loss for the region, which in turn led to the economic displacement of millions of working-class Whites.
Before 2016, the Rust Belt was a Democratic stronghold. Blue-collar Whites, who are heavily concentrated in the upper Midwest as shown in Figure 1, were once the bedrock of support for the Democratic Party. In 1932, the socio-demographic group formed part of FDR’s New Deal Coalition. This alignment lasted until the 1960s with the shattering of the New Deal Coalition along racial lines during the Civil Rights Era. Afterward, working-class Whites increasingly began to vote for Republican candidates in national elections, backing Nixon and Reagan in 1972 and 1984. However, this exodus was partly halted when President Bill Clinton brought them back into the fold in 1992.
Figure 1 – County-level distribution of white working-class Americans

Note: Choropleth map created by The Author using data from the American Community Survey (ACS) 2012-2016 5-year estimates, obtained via the NHGIS website. Variable includes the number of non-Hispanic white Americans aged 25 or over without a college education as a percentage of the total county population. Source: US Census Bureau/IPUMS NHGIS University of Minnesota (2019)
Trump’s strategy involved tearing down the “blue wall” of states that had voted reliably Democratic for president for the six election cycles between 1992 and 2012. These states included Michigan, which had last voted Republican in 1988, as well as the states of Pennsylvania (1992), Wisconsin (1984), and to a lesser degree Minnesota (1972). Understandably, these were the states that Trump spent the most time rallying in during the 2016 general election season. Figure 2 shows that Trump attended most of his rallies in the traditional swing states of Ohio Florida, and North Carolina as would be expected. Yet, he also attended a significant number of rallies in aforementioned “blue wall” states of Wisconsin, Michigan, and Pennsylvania.
Figure 2 – Frequency of Trump rallies in the 2016 general election season, by state
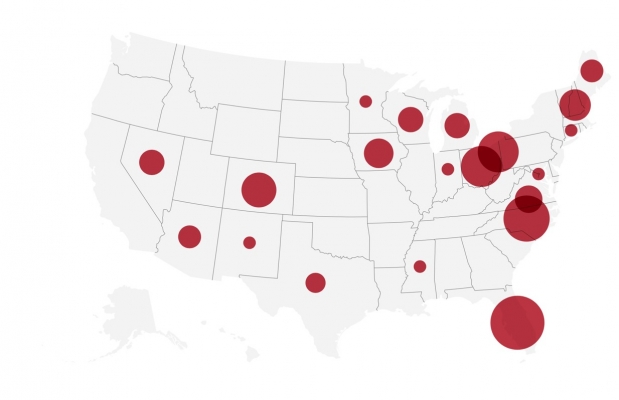
Note: Symbol map created by The Author using data from Trump’s 2016 campaign schedule. The size of the red circles within states are indicative of the number of rallies Trump attended there. Larger circles indicate a greater number of visits to a given state
Such a strategy was considered ambitious, given that states in the “blue wall” had been fool’s gold for Republicans in past cycles. For example, Pennsylvania had been called the “white whale” of GOP politics by psephologists for the state’s reticence in electing Republicans, not having done so for 28 years. The Democrats lock on these states had given the party a structural advantage in the Electoral College during this time due to the relatively small number of non “Blue Wall” states with the sufficient electoral votes to give Republicans victory.
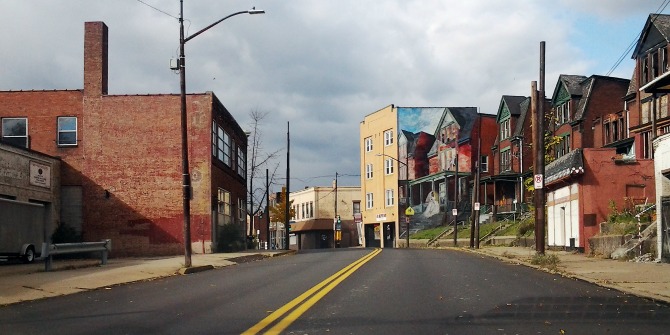
“Pittsburgh, The Bride on Penn Avenue, Garfield” by William Real is licensed under CC BY NC SA 2.0
However, political scientists such as Nate Silver began to question the robustness of the “blue wall” for the Democrats during the 2016 cycle. Before 2016, a candidate like Trump had not been on the ballot in the Rust Belt states to test the receptivity of the white working-class towards a more populist message. The question of the relative dominance of the Democratic Party in these “blue wall” states thus became especially relevant when Trump, with his populist overtures to the “forgotten” blue-collar workers of the Rust Belt, became the GOP nominee.
Trump’s strategy to go after Rust Belt states in the “blue wall” is consistent with his appeal to white working-class Americans. This is because the sociodemographic group are concentrated in states that are considered part of the Midwest and Northeast “blue wall”, as Figure 1 shows.
Trump confounded the pundits and polling class in 2016 with his victory in the Rust Belt. His win came down to 77,744 votes in Michigan, Pennsylvania, and Wisconsin.
Looking forward to 2020, Trump can ill afford to lose any of these states if he is to win re-election. Given Trump’s current low approval ratings in the critical Rust Belt states relative to the rest of the nation, his re-election will partly depend on who the Democrats nominate for 2020.
If, as current Democratic primary polling indicates, Trump faces Joe Biden in the general election, his path to retaining the White House becomes more complicated: Biden is from the Rust Belt state of Pennsylvania and has made a clear play to win back working-class Whites who voted for Trump in recent months. The two will thus be competing for the same pool of voters in a likely matchup. If that is the case, then the question as to who the real champion of the white working-class is will be a central feature of the general election campaign.
Please read our comments policy before commenting.
Note: This article gives the views of the author, and not the position of USAPP – American Politics and Policy, nor the London School of Economics.
Shortened URL for this post: http://bit.ly/2Ke3mwC
About the author
Jack Thompson – Nottingham Trent University
Jack Thompson is a PhD student at Nottingham Trent University researching American politics and White American voting behaviour. His thesis project examines the predictors of White American voter choice for President in the 2016 US presidential election.

The Democratic Party’s opportunity to nominate Elizabeth Warren and win the White House passed four years ago. A recent ethnographic tour by yours truly of Western Pennsylvania, New York State, Massachusetts, and New Hampshire unfortunately indicates a certain billionaire’s fan support extends far beyond the traditional Rust Belt. Nonetheless, expect record votes in 2020 for America’s third and fourth largest political parties – Libertarians and Greens.