 Last month New Jersey governor Phil Murphy won a second term, the first Democrat to do so in the Garden State for 44 years. Julia Sass Rubin takes a close look at the results of the off-year election, which saw a Republican red wave in some parts of the state and Democratic gains in others. The state’s uneven electoral geography, she writes, could have important implications for Democratic control of Congress in the long term.
- Following the 2020 US General Election, our mini-series, ‘What Happened?’, explores aspects of elections at the presidential, Senate, House of Representative and state levels, and also reflects on what the election results will mean for US politics moving forward. If you are interested in contributing, please contact Rob Ledger (ledger@em.uni-frankfurt.de) or Peter Finn (finn@kingston.ac.uk).
On the face of it, New Jersey’s latest statewide election on November 2nd did not bring much change. Democrats maintained strong majorities in both the State Senate (60 percent) and Assembly (58 percent) and Democratic Governor Phil Murphy was reelected to another four-year term.
Beyond this topline, however, the results can seem somewhat confusing.
Although Murphy’s 3.2 percent margin of victory was smaller than what pre-election polling had predicted, he was the first Democratic governor of New Jersey to win reelection in 44 years. He also was the first candidate in 40 years to win the governorship of either New Jersey or Virginia (the two states that hold odd-year elections for governor and the state legislature), in the year after his party’s candidate first won the presidency.
Murphy received 11.3 percent more votes than he had in 2017. In three counties – Hunterdon, Mercer, and Somerset – Murphy also won a larger share of the total vote than he had in 2017, when he ran against the lieutenant governor of a very unpopular Republican incumbent, Chris Christie.
Murphy’s challenger, former Assembly Member Jack Ciattarelli, received 39.5 percent more votes than the Republican candidate for governor did in 2017. He also won three counties – Atlantic, Cumberland and Gloucester – that Murphy had carried four years earlier.
Democrats lost eight seats in the legislature – two in the State Senate and six in the Assembly. However, two of the Assembly seats were lost by very small margins (347 and 622 votes), with a 3rd party Green candidate drawing more than 1,150 votes from both Democratic candidates. Democrats also gained a State Senate seat in Central Jersey that had been held by Republicans for 48 years.
What explains these seemingly divergent results and what does it all mean for the future of New Jersey politics?
What Happened?
The substantial uptick in votes for Republican candidates in much of the state suggests that the red wave that swept Virginia and other parts of the country was evident in New Jersey as well. Republicans were energized as the party out-of-power at both the federal and state levels, and the lingering COVID-19 pandemic, rising inflation, and infighting among congressional Democrats likely further boosted their enthusiasm.
While more New Jersey Democrats voted than in 2017, in most of the state the Democratic increases were smaller than Republican ones. This pattern of greater enthusiasm by the party out of power helps explain why the party that took the Presidency lost Virginia and New Jersey in 17 out of the last 20 gubernatorial elections.
New Jersey’s 2021 Democratic turnout also may have been dampened by pre-election polling that consistently showed Murphy with sizeable leads. The expectations of an easy reelection were so pervasive that the editorial staff of the Jersey Journal, a media outlet in overwhelmingly Democratic Hudson County, advised their readers to leave the governor’s contest blank on their ballots to register their displeasure with Murphy’s failure to protect a local state park. The Jersey Journal editorial staff emphasized that not voting for Murphy was OK because he would “almost certainly win a second term.”
Another indication that expectations of an easy victory may have dampened Democratic turnout is the fact that the three counties in which Murphy exceeded his share of the vote total relative to 2017 were the sites of hotly contested state senate and assembly races that likely increased voter engagement. Competitive legislative races are rare in New Jersey, where largely non-competitive legislative districts result in most general election outcomes being a foregone conclusion.

“Governor Murphy, First Lady Tammy Murphy” (CC BY-NC 2.0) by GovPhilMurphy
New Jersey’s uneven electoral geography
While these factors help explain the overall levels of support by party, why were the results so different across the state?
New Jersey has been trending increasingly Democratic over the last few decades. Since 2000, Democratic registration has outpaced Republican by more than two to one. As of November 2021, 39 percent of New Jersey voters were registered as Democrats; 23 percent as Republicans, and 38 percent as unaffiliated and third parties. This translated into a 1,070,292 statewide voter advantage for Democrats over Republicans.
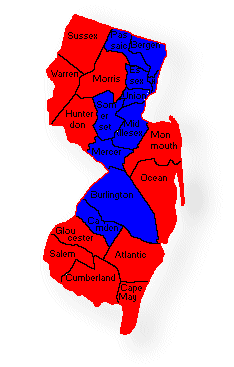
That registration advantage is not evenly distributed by geography, Democrats hold substantial majorities in the northeast and central-west while Republicans have majorities in seven counties located in the northwest, along the central shore, and in parts of the south (Figure 1).
Figure 1 – New Jersey election results by county
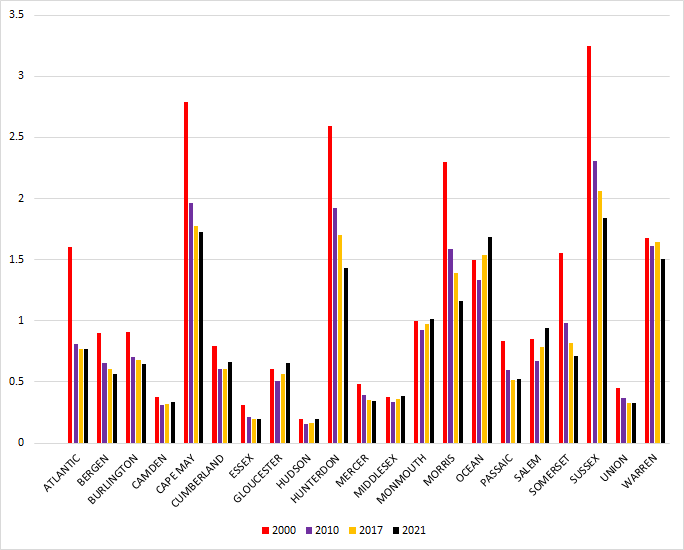
As Figure 2 shows, over the last twenty years, the four majority Republican counties in the northwestern part of the state have consistently trended towards the Democratic party. This is particularly noticeable in Hunterdon and Morris counties, which have some of the highest rates of college graduates in the state, reflecting the national trend of college educated voters moving towards the Democratic party. One indication of this trend is that President Joe Biden’s 2020 vote share in the four northwestern counties was higher than what Democratic presidential candidate Hilary Clinton received in 2016. Biden also won Morris County, becoming the first Democratic Presidential candidate to carry that county since 1964.
Figure 2 – Percentage of Registered Republicans to Registered Democrats by New Jersey County 2000-2021
Source: US Census Bureau
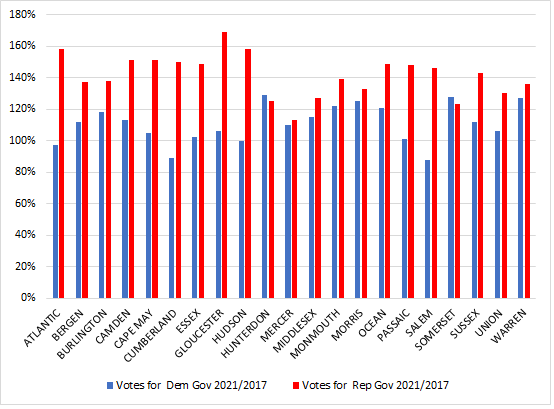
Although Governor Murphy lost all seven majority-Republican counties in both 2017 and 2021, in three of the northwestern counties – Hunterdon, Morris, and Warren – as Figure 3 shows, he had some of the largest percentage increases in his total number of votes relative to 2017.
Figure 3 – Percentage voting for Democratic and Republican gubernatorial candidates 2017/21 across New Jersey counties
Source: US Census Bureau
By contrast, Murphy performed much worse in the southern part of the state, losing the five southernmost counties, including three he had carried in 2017. The two State Senate seats and four of the six Assembly seats that Democrats lost were also in the southern part of the state.
One explanation for Democrats’ poor performance in the southern counties is the national shift of white working class voters towards the Republican party. The five southernmost counties have some of the lowest rates of college completion in the state. Most also have higher percentages of non-Hispanic whites than the state as a whole. One sign of this shift is seen in registration patterns in New Jersey’s southernmost counties, which have been trending more Republican over the last four years, including the three counties that Murphy won in 2017 but lost in 2021.
Another possible explanation is that the South Jersey Democratic political machine, which clashed with Murphy for most of his first term, did not push as hard as it could to get the vote out for the governor.
What does all this mean for the 2022 election and the political future of the state?
The diverse voting patterns of New Jersey’s 21 counties that were highlighted by the 2021 election underscore the importance of the redistricting process for determining the outcome of the 2022 midterm elections. New Jersey’s congressional and legislative redistricting is done by bipartisan commissions, with an equal number of members appointed by the leaders of the state Democratic and Republican parties. The Chief Justice of the State Supreme Court appoints a tiebreaker for each commission. Depending on whose map the tiebreaker selects, New Jersey could lock in the current 10 to 2 Democratic congressional advantage or move closer to the congressional distribution of 6 Democrats and 6 Republicans that the state had after the 2010 redistricting. The outcome would have obvious and substantial consequences for the Democrats’ ability to maintain their majority in the US House of Representatives.
Longer term, New Jersey is likely to continue the trend of increasing Democratic dominance in both congress and the state legislature. Apart from Monmouth and Ocean, the two Republican trending counties on the eastern shore, population growth in the state has been concentrated in the Democratic strongholds. While the state population increased by nearly six percent over the last decade, three of the five southern counties that Murphy lost in 2021 experienced declines in population, as did majority Republican Sussex County in the northwest. Assuming the current population and party registration trends continue, there will be fewer Republican-majority counties and those that remain will be increasingly geographically isolated, making it easier to consolidate them into fewer congressional and legislative districts.
- Editor’s note: This article was amended on 15 December 2021 to clarify that Governor Phil Murphy was the first candidate in 40 years to win the governorship of either New Jersey or Virginia in the year after his party’s candidate first won the presidency.
Please read our comments policy before commenting.
Note: This article gives the views of the author, and not the position of USAPP – American Politics and Policy, nor the London School of Economics.
Shortened URL for this post: https://bit.ly/30qvetn
About the author
 Julia Sass Rubin – Rutgers University
Julia Sass Rubin has been part of the faculty of the Edward J. Bloustein School of Planning and Public Policy at Rutgers University since 2003. Dr. Rubin’s research interests include nonprofit and public organizations and processes, developmental finance, and the intersection of education policy, community development and social justice.






An excellent analysis overall but in terms of the democratic turnout we need to look at turnout by municipality rather than just the county level.
While Democratic turnout was up from 2017 overall, it appears to have lagged in cities.
The county data from the most Urban counties, Hudson and Essex, show lower Democratic turn out than elsewhere. This trend is most pronounced in South Jersey where Democratic turn out in the city of Camden actually fell from 2017 to a truly pathetic level of 15 to 16%. There were similar patterns in Bridgeton and Atlantic City, even with a mayor’s race on the ballot in AC.
Any analysis of the 2021 election should focus on why Urban voters did not turn out for the Governor race and not just increased Republican numbers in more suburban areas.
Finally while the shift of white working class voters in South Jersey to Republicans is pronounced it’s not the only story. Cumberland County has been a reliable Democratic County and is very close to being a majority people of color county as well. Joe Biden and Amy Kennedy had clear victories there in 2020 yet Democrats got smoked in 2021.