
 Those who believe that Donald Trump won the 2020 presidential election have held up his victories in many bellwether counties as evidence of electoral fraud. In new research, Bernard Grofman and Haotian Chen argue that the evidence shows that this claim is laughable. They write that the electoral record shows that not only are bellwether counties poor predictors of who will win a presidential election, rising polarization means that their ability to predict long streaks of elections has been in decline over the last two decades.
Former President Trump and his supporters continue to loudly assert that he really won the 2020 election even though all the alleged direct evidence of fraud has not passed the “sniff test” of local courts, including those with Republican judges. The indirect evidence for election fraud rests on various statistical claims about the high level of improbability of certain features of the 2020 election. One such claim is that Trump’s victories in 2020 in the vast bulk of the counties that had previously been labeled as bellwethers proved that Trump really won the election and was denied the victory because of fraud.
This claim is basically absurd. We find that bellwether success is almost entirely a matter of random coin tosses in multiple counties over time to create an appearance of predictive power that is a matter of chance. The Princeton political scientist, Edward Tufte opens his 1975 co-authored article on bellwethers with: “Prior to the 1936 presidential election, the conventional political wisdom had it that as Maine voted, so went the rest of the nation. After the 46-state landslide, James Farley, Roosevelt’s campaign manager, revised the theory: ‘As goes Maine, so goes Vermont’.”
Bellwethers aren’t great at predicting the future – or the past
And yet, the belief in bellwether states or counties as predictors of US presidential elections is a phoenix that is constantly being reborn. It is as if the devastating rebuttals by Tufte in Data Analysis for Politics and Policy or the equally devastating review of the evidence in David A. Hopkins’ 2017 book Red Fighting Blue never happened. In a 2020 article, Daniel Zimny-Schmitt and Michael Harris look for bellwether counties in the period 1980-2016 and identify nineteen such. In an October 7, 2020, essay in the New York Times, David Wasserman looked to ten allegedly bellwether counties for evidence that Donald Trump is in serious trouble. Articles after the 2020 election examining the predictive power of previous bellwethers are found in other sources, including the Wall Street Journal and the Epoch Times.
But not only are bellwethers not really predictors of future success, the likelihood of finding long streaks of prior predictive success has gone down. Comparing the most recent elections (2000-2020) to those in earlier periods (1960-1980), we find a striking decline in the proportion of bellwether counties, i.e., those with correct prediction in past elections. Our model also links this decline to increases in polarization. Bellwethers must make correct predictions regardless of which party wins election, but polarization makes it increasingly likely that counties will split into ones that vote regularly for a Republican or for a Democratic presidential nominee. Thus, as polarization rises, the potential for counties shifting their mean party preference across different elections declines.
The attraction of the idea of bellwether states and counties
Why is belief in the existence of bellwether states and counties (especially the latter) so strong? We believe that there are two main reasons.
First, we can readily imagine that some counties demographically/politically mirror the nation, and thus monitoring this small set of counties closely would tell us with high predictive reliability what will happen nationally. This belief in the efficacy of small numbers is probably strengthened by the fact that a random sample of only 2,000 or so voters is considered by statisticians large enough to predict election results in an electorate of well 140 million or so – at least if the sample is truly random and the respondents are not lying either about their preferences or the likelihood that they will vote in the election.
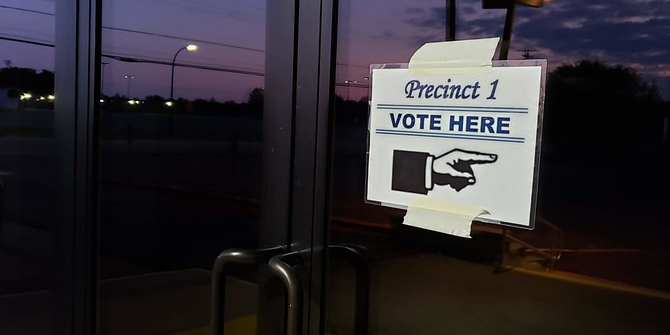
 “Election Day (Ypsilanti Township, Michig” (CC BY-NC-SA 2.0) by cseeman
Second, when we examine a short string of elections, we do indeed, find that some counties go with the winner in all (or virtually all the elections). Thus, for some sequences of elections there are indeed, bellwether counties.
Unfortunately, however, neither of the reasons for why we might think that previous bellwethers will continue to be bellwethers is valid. With respect to the notion that bellwethers are demographically representative, this appears not to true. In particular, recent research which identified nineteen bellwether counties found that they “tended to be whiter, older, less educated, have lower median incomes, have a lower percentage of workers in the labor force, and have higher rates of vacant housing than the country as a whole.” These counties also disproportionately came from the Midwest and the Northeast. Moreover, if we look at the political features of the bellwethers, we do not find them exclusively among counties that are highly politically competitive. Of their nineteen bellwethers, only Essex County, Vermont can be considered as a political competitive county.
So, where are the bellwether counties?
If it is not demographically representative counties or politically competitive counties which are the bellwethers, why then do we find bellwethers? The simple answer is that chance effects can be much greater than most people realize. Even if the mean likelihood of a match between county and presidential outcome is exactly 50 percent, in the classic argument offered by Deutsch and Madow in 1961, on the appearance of wisdom in large organizations, some counties will, by chance alone, have high records of predictive success and some may even have perfect records, especially if there are many counties and if we limit the number of elections over which we are requiring successful predictions.
As Figure 1 shows, with roughly 3600 counties, the number of counties which correctly predict the election’s outcome can be non-trivial even for relatively long sequence of elections when the probability of a correct prediction is exactly 50 percent, i.e., a coin flip.
Figure 1 – Counties expected to have unbroken or near unbroken string of correct matches with national election outcome if each county has a 50 percent chance of voting for the winner
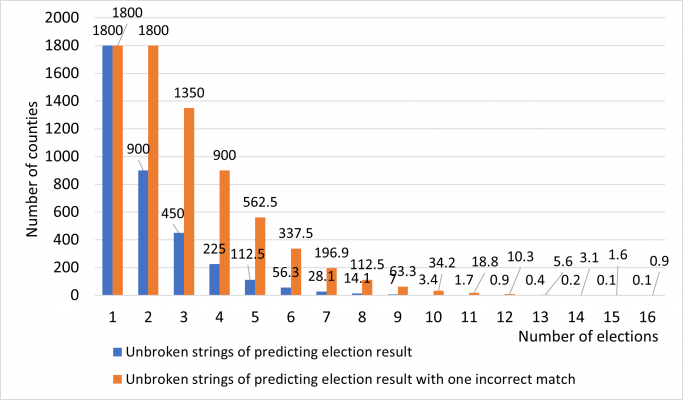
For example, across seven elections, we would expect to see 28 bellwether counties. Moreover, once we allow for bellwethers to have less than perfect records of success, the expected numbers of bellwethers increases much more rapidly than most (including us) would expect. For example, if we call a county a bellwether if it has one less correct match than the number of elections in a sequence, we will get nearly 19 bellwethers even in a set of eleven elections, and in a set of seven elections, we will see 197 bellwethers – far more than the 27 we would find under our assumptions when we require a bellwether to have an unblemished record of predictive success.
- This article is based on the paper, ‘Understanding the Factors that Affect the Incidence of Bellwether Counties: A Conditional Probability Model’, in Political Research Quarterly.
- The participation of the authors was supported by the Peltason Chair at the University of California, Irvine.
Please read our comments policy before commenting.
Note: This article gives the views of the author, and not the position of USAPP – American Politics and Policy, nor the London School of Economics.
Shortened URL for this post: https://bit.ly/3JzjZ3j
About the authors
Bernard Grofman – University of California, Irvine
Bernard Grofman is Distinguished Professor of Political Science and Jack W. Peltason Chair of Democracy Studies at the University of California, Irvine.
Haotian Chen – University of California, Irvine
Haotian Chen is a Ph.D. student in political science at the University of California, Irvine.

If you take the logic in this article, then there should have only been 3 counties that had predicted the election since 1980. There was 19 counties over 10 elections showing clearly that these counties have a correlation with the presidential winner with a significant P Value compared to a random set. Your theory actually proves bellwether counties as statistically significant.
Huh, so it suddenly doesn’t matter since bidet won, even though every news channel hyper focuses on the bellwether counties? Funny stuff.