 In the 2022 midterm elections a small minority of elections for the House of Representatives were competitive, with most seats likely to be won by the either the Republican or Democratic Party. An election’s final vote count is the measure of choice for most who look at electoral competitiveness, but in new research, Danielle M. Thomsen looks at candidates’ election fundraising as a measure of how close resources were distributed among candidates. She finds that in open seats with no incumbent candidates—the best-case scenarios of competition– 55 percent of races are competitive using the vote share measure, while only 40 percent are competitive using a fundraising measure.
In an era of narrow majorities in Congress, more and more attention is directed toward the few election races that are likely to be competitive. Election forecasters use a variety of factors to predict which races will be hard fought and which will be heavily lopsided towards one candidate.
Political scientists have generally evaluated how competitive an election was in large part by whether the outcome was close. One strength of vote share measures of competition is that collecting the data is more straightforward. Vote totals also have the most direct consequences for the election of officeholders. Yet the reliance on votes has limitations as well. Outcomes can indicate which races were likely viewed as competitive, but only after the election. Nor do votes always reflect how candidates were perceived prior to the election.
Using fundraising to measure the competitiveness of elections
In new research, I look at the quality of competition in an election through the lens of fundraising. The influence of money in American elections makes fundraising an especially appropriate alternative to the ballot. Campaign war chests are one of the most widely used indicators of viability and vulnerability prior to an election. Resource disparities matter for both material and symbolic reasons. Donations have direct implications for whether candidates can access what they need to fuel their campaigns. A strong fundraising haul also attracts attention from the media and partisan elites. The use of fundraising receipts as an indicator of electability has become even more prevalent as candidates raise record sums of money with each election cycle.
My research focuses on primaries due to their increasing role in the selection of officeholders. I use preelection receipts in more than 16,000 US House primaries from 1980 to 2020 to construct new fundraising measures of competition. The first is a binary indicator of whether the top fundraiser raised less than 57.5 percent of total preprimary receipts. The second is a weighted measure of the effective number of candidates in the race calculated with receipts (following the influential work of Markku Laakso and Rein Taagepera on the effective number of parties). I compare these fundraising measures with the same measures based on vote shares to examine how and where they differ.
Fundraising data shows elections are less competitive though the lens of resources
The short story is that when the quality of primary competition is viewed through a fundraising lens, it looks markedly worse than vote share measures suggest. Fewer races are competitive, and the number of candidates declines. Open-seat primaries are often held up as bright spots in an era of low levels of general election competition, but the difference between vote share and fundraising measures is largest in open seats. The likelihood that an open-seat primary is competitive with vote share measures but not fundraising measures increases by 15 percentage points, and the effective number of candidates calculated with receipts decreases by nearly half in safe districts and by 40 percent in competitive districts. The disparity between vote share and fundraising measures is driven largely by financial longshots who outperform their receipt share at the ballot box. The quality of competition in these best-case scenarios is increasingly relevant as more elections are decided at the primary stage.
“P6270990” (CC BY-NC 2.0) by tkmckenzie
The top graphs in Figure 1 below show the percentage of primaries where the top vote-getter received less than 57.5 percent of the vote and where the top fundraiser raised less than 57.5 percent of receipts. The bottom graphs show the total number of candidates and the effective number of candidates with receipts. The data are broken down by incumbent-contested primaries (an incumbent is in the primary), challenger-party primaries (an incumbent is in the opposite party), and open-seat races (there is no incumbent in either party primary).
Figure 1 – Top fundraiser results and candidates in primary elections
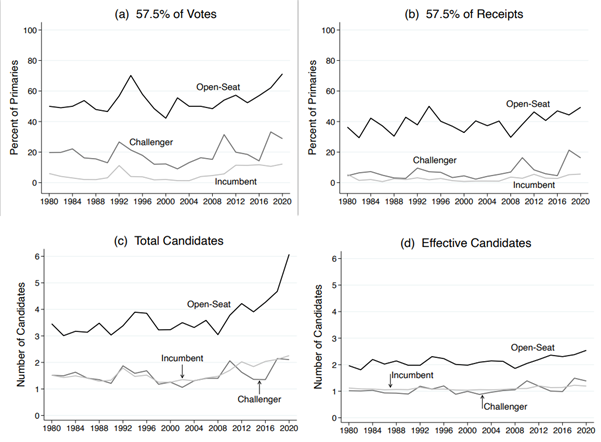
Two main patterns emerge. First, the fundraising measures reveal lower levels of competition across primary types. In open seats, 55 percent of races are competitive with the vote share measure, compared to 40 percent with the fundraising measure. In challenger-party primaries, 19 percent of races are competitive with the vote share measure, versus 7 percent with the fundraising measure. Very few incumbent-contested primaries are competitive, but the share is lower with the fundraising measure (6 vs. 3 percent). On average, the total number of candidates is 1.6 in incumbent-contested primaries, 1.5 in challenger-contested primaries, and 3.7 in open seats. By comparison, the effective number in each is 1.1, 1.1, and 2.1, respectively.
Second, differences between the number of candidate measures are more pronounced in recent election cycles, particularly in open-seat primaries. The total number of candidates in open seats has risen sharply since 2008. From 1980 to 2006, the average total number of candidates in incumbent-contested, challenger-party, and open-seat primaries is 1.4, 1.4, and 3.4, respectively. These figures increase to 1.9, 1.7, and 4.3, respectively, in the period from 2008 to 2020. Whereas the total number of candidates doubled from 2008 to 2020 in open-seat races, the change in the effective number of candidates is much more muted.
Where vote share and fundraising measures differ most
I also calculated the difference between the fundraising and vote share measures to examine where they differ most (whether the race is competitive with the vote share measure minus whether the race is competitive with the fundraising measure; the total number of candidates with votes minus the effective number of candidates with receipts). The left graph in Figure 2 below shows the probability that the primary is competitive with the vote share measure but not the fundraising measure. The right graph shows the expected difference between the number of candidates with the vote share and fundraising measures; positive values correspond to an increase in the number of candidates with the vote share measures.
Figure 2 – Primary competitiveness and number of candidates
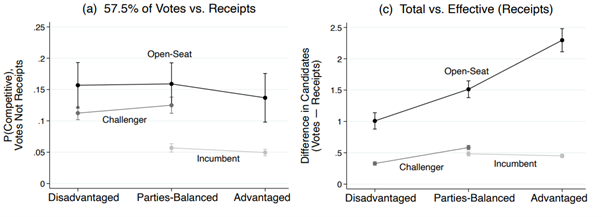
Competition looks better with vote share measures across primary types, but the disparity is smallest in incumbent-contested races and largest in open seats. In advantaged-party open-seat primaries, the probability that a primary is competitive with the vote share measure but not the fundraising measure increases by 14 percentage points. In parties-balanced open seats, the probability increases by 16 percentage points.
The number of candidates results also reveal sizable differences between measures. The disparity between the total and effective number of candidates based on receipts reaches a height of 2.3 candidates in advantaged-party open-seat primaries (from 4.9 total to 2.6 effective candidates) and 1.5 candidates in parties-balanced open-seat primaries (from 3.6 total to 2.1 effective candidates).
How we think about competitiveness matters
It is difficult to say what truly counts as competition, but this research can start a new conversation about how our conclusions about the quality of competition are tied to the measures we use. Fundraising is a valuable metric because it matters for whether candidates can access the resources associated with winning and whether they are perceived as viable contenders. A small minority of candidates overcome the odds and win without raising as much money, but the ability to fundraise is seen as an advantage by most candidates who win. And while long-shot candidates do occasionally outperform their receipt shares at the ballot box, they overwhelmingly lose and usually by large margins.
Primaries have attracted more attention in recent years due to the lack of close general elections. My findings in open seats are thus particularly troublesome due to the role these primaries play in ensuring that elected officials face high-quality competition before they are selected initially. It may be difficult to agree on how competitive our elections should be or how many elections ought to be close, but the sheer volume of work in this area reflects a broader assumption that, at some point prior to or during an officeholder’s tenure, there is a clear benefit of close elections.
That competition is lower when we use a fundraising lens is concerning because of the fundamental role that competition plays in American democracy.
- This article is based on the paper, ‘Competition in Congressional Elections: Money versus Votes’, in American Political Science Review.
- Please read our comments policy before commenting.
- Note: This article gives the views of the author, and not the position of USAPP – American Politics and Policy, nor the London School of Economics.
- Shortened URL for this post: https://bit.ly/41jEXLz