

To what extent will the approval of party leaders matter in the 2015 general election? A previous post on this blog showed that, historically, party leader approval ratings are predictive of election outcomes. In this post, Geoffrey Evans and Jon Mellon show that the effects of party leaders vary across parties: Nigel Farage has the potential to help UKIP in winning votes; David Cameron has a smaller positive impact for the Conservatives, and Ed Miliband is a modest liability for Labour.
Never a day seems to go by without party leaders featuring in the media as heroes, villains, or klutzes. The emphasis of these reports often depends on the political leanings of the media involved, at least with respect to newspapers. Leaders are, after all, the public faces of their parties. For reporters and politicos alike it is assumed that leadership – or at least the image of leadership – matters for the electorate: that it influences votes. This assumption has been far less widely held in academic research on voting, where more attention has been paid to voters’ social background, the issues parties present to the public, or party stewardship of the economy or treasured institutions such as the NHS. But even amongst academics there has been a growing emphasis on party leaders and how they shape support for their parties – especially when it comes to short-term party switching (eg Clarke et al 2004; Evans and Andersen 2005; Evans and chzhen 2013).
In the run-up to the 2015 election the leadership question is particularly pertinent. Several years of exposure to Ed Miliband’s bacon sandwich consumption skills, Nigel Farage’s ‘beer drinking man in street’ persona, and David Cameron’s Bullingdon Club bravado, amongst many other things, suggest voters’ images of leaders may have real significance for electoral outcomes.
Journalistic talk of leaders’ impact is often based on fairly simple observation of the public’s approval ratings. Academic scepticism, by comparison, often derives from evidence that party support influences judgements about leaders, or that leaders approval ratings can simply be a proxy for policy/performance approval. In this blog we present some evidence from our analyses of whether people who change their evaluations of leaders also switch their votes, using Waves 1 – 3 of the BES panel study (N= 22,334).
Our approach is to combine evidence on leaders’ approval levels measured on 10-point scales asking how much people like or dislike the main party leaders with estimates of the impact of these on changes in party choice. If leaders are popular amongst a relevant target group and their evaluations help explain vote switching over time we interpret this as evidence that they’re having a positive impact. If they’re not popular and help explain vote switching over time then we take this as evidence that they’re having a negative impact. Anything else – i.e. neutral evaluations, no effect on change – and they’re probably not that consequential. For each of the main party leaders we also look at recruitment (do they attract or dissuade people from other parties?) and retention (do they keep or repel people from their own?) factors. For all these things we also consider controls for other factors that can influence vote switching. Through this method we examine how changing levels of approval are associated with vote switching over a politically lively 7 month period. We expect this will be pertinent for interpreting the next 3 months of even more intensive political activity.
So what do we find? To estimate retention and recruitment effects we focus on two groups:
- Risk group for defections: leader’s party supporters in February.
- Risk group for recruits: everyone else in February.
The leader approval scores and movements of the different risk groups are shown below:
Do you like or dislike each of the following party leaders?
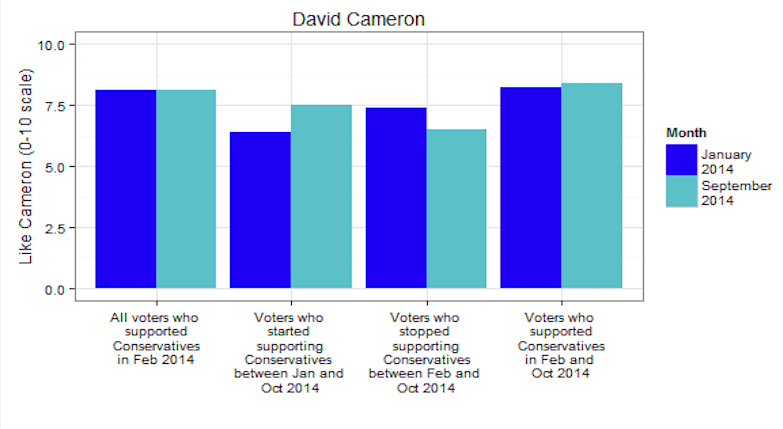
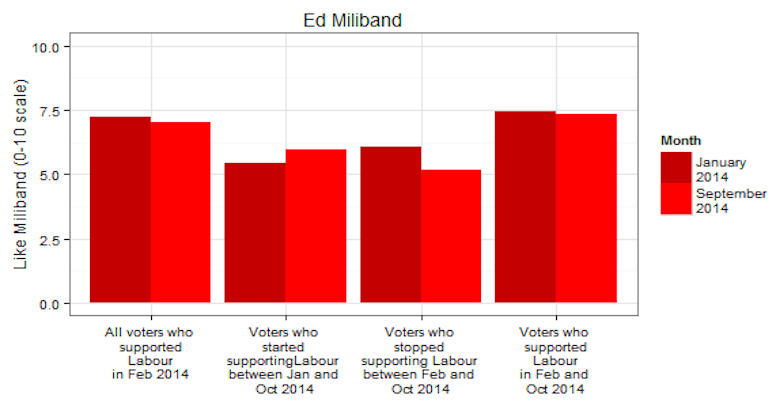
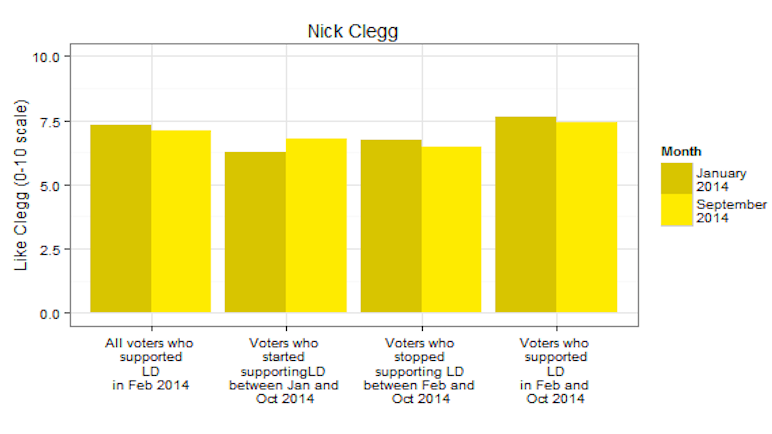
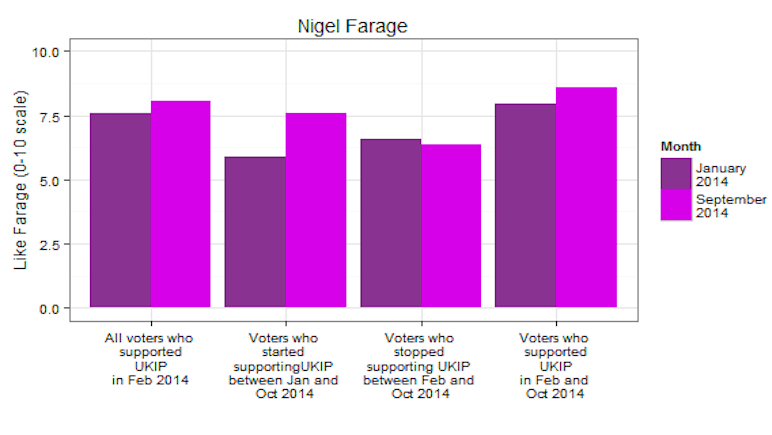
There are only small overall aggregate changes amongst partisan groups during this period. Among their own supporters, Cameron’s appeal increased a little, Farage’s somewhat more, Clegg and Miliband’s declined a little. The changes among vote switchers are, however, interesting. Those who moved to UKIP had far higher ratings of Farage in Wave 3 than Wave 1. Those who left the party were only slightly less positive towards him. Those who moved to and from the Conservatives were less polarized about Cameron, and fairly similar in their relative approval/disapproval. Miliband’s ratings dropped somewhat more among those who left Labour than increased among those who moved towards them. Clegg’s approval changes were modest among both defectors and recruits.
So the changes in approval ratings by supporters (potential defectors) and all others (potential recruits) suggest that, in particular, Farage will be an asset to UKIP. But this only applies if people who move to UKIP do so in part because their opinion of Farage changes, net of other considerations. We can estimate this with our change-on-change models. An example of a full model is given in the appendix, as is a summary of effects from all of the models. They show that Clegg has more or less no impact on retention or recruitment, so we shall focus on the other three leaders. The predicted probabilities for the effects of Cameron, Miliband and Farage, for retention, recruitment and net effects – are displayed in the graphs below.[1]

These estimates are of the % party vote loss produced by changes in leader evaluations between waves 1 and 3. Although Cameron’s overall support among his supporters remained steady, his support among Conservative defectors dropped substantially. This is reflected in our estimate that he was responsible for between 10% and 14% of all Conservative defections in this period. Miliband was responsible for nearly as high a proportion of defections, with between 8% and 10% of the defections from Labour being attributable to his ratings.
We can also look at what proportion of recruitments to a party are attributable to its leader.

These estimates are for the % change in party vote recruitment produced by changes in leader evaluations between waves 1 and 3. Miliband fares the worst, with almost none of the new recruits to Labour being attributable to his ratings. Farage and Cameron both have much higher effects on recruitment. For both of them, we estimate that around 17% of all new recruits joined because of changes in the recruit’s estimation of the leader.
But how do these recruitment and retention effects combine in total?

The combined effect of changes in leaders’ evaluations show that Farage is the major winner for his party, Cameron very modestly so, and Miliband is a modest liability.
So all leaders, and all parties, are not created equal. The leaders of more established parties, where many voters have long-standing attachments to the party, habits that aren’t easily broken, are likely to be of less consequence than the leader of a new(ish) party, which by comparison has no reservoir of identity or habitual endorsement. Very few (if any) current UKIP voters will have spent their childhood and formative years in UKIP supporting households. So the impact of Farage, is far more significant for UKIP’s votes than the leaders of the older, well-established, parties are for their votes.[2] Charismatic leadership can often be the key to a break-through when building parties (as Alex Salmond has arguably demonstrated in Scotland), but it’s a precarious platform, vulnerable to a poor performance. Ukip‘s support is more volatile than the two main parties. They pull in people from the Conservatives, Lib-Dems, Labour and ‘Don’t Knows’ but they lose them too – with lower retention levels than either Labour or the Conservatives.

Farage’s own personal evaluations also have lower levels of correlations across the waves: 0.75 compared with 0.86 for Miliband and 0.85 for Cameron, so evaluations of him are also less fixed. So in short Farage needs to keep it up in order to counter the drain in support his party tends to suffer from, as well as stabilize opinions of him personally. The next few weeks should prove interesting.
Conclusions
We have demonstrated robust leader image effects using only a simple 10-point scale of like/dislike. These estimates are in that sense highly conservative: more sophisticated multi-item measures could be expected to produce even stronger findings. From this analysis alone, however, we can point to a range of important conclusions.
Despite recent negative headlines, Nigel Farage has the potential to boost the electoral prospects of the party he leads to a greater degree than any other leader. In addition, however, support for UKIP is flimsier than the other parties, with many voters switching away from UKIP regardless of Farage’s appeal. UKIP increased their support over the past year despite losing larger proportion of supporters than the main parties to a fair degree because of him, so if he stopped attracting new supporters, their support would start to decline. That means that Farage will need to outperform the other party leaders – in terms of winning votes based on his popularity – if UKIP are to maintain their support going into the election.
The analysis also implies qualified good news for David Cameron: the Tory leader can be effective in winning votes, though if he slips up he can lose them too. He’s a modest asset in this respect. However, Ed Miliband’s appeal is unlikely to help Labour’s chances of success at the ballot box. He’s a slight net drain on Labour’s support and may well turn more voters off when he is in the spotlight as the General Election campaign gathers momentum. Nick Clegg, is certainly not toxic as some have implied, and is unlikely to reduce the popularity of his party – but he probably won’t increase it either – which given the erosion of their support is cheerless news for the Lib-Dems.
Notes:
[1] Farage’s net effect is about 0.8 percentage points of UKIP’s share of the vote. UKIP rose 1.6 percentage points between wave 1 and wave 3; without his impact on voters UKIP would only have increased their vote share by half as much.
[2] These display estimated lower and upper bound effects, according to how many other factors we control for in the models.
This post was originally published on the British Election Study’s blog, and is reposted here with their permission.
APPENDIX
A. Example of change-on-change model (Conservative origins)

B. Summary effects table

Geoffrey Evans is an Official Fellow in Politics at Nuffield College, Oxford and co-director of the British Election Study 2015.
Jon Mellon is a post-doctoral Research Fellow at Nuffield College, Oxford.


3 Comments