 Over the past few months, Terence Huw Edwards (Loughborough University, left), Christian Soegaard (Warwick University) and Mustapha Douch (Aston University) have been investigating how the vote of June 23 2016 has since affected the values and patterns of Britain’s trade with major trading partners inside and outside the European Union. By comparing trade flows with a model of what UK trade flows would have looked like had the UK voted to stay in the EU, we can clearly see that British exports to both EU and non-EU countries have taken a hit.
The very fact that Brexit hasn’t actually happened yet makes this question even more interesting to us as trade economists. No tariffs or trade barriers have been placed between the UK and EU, and yet companies are already aware that, depending upon the final deal, there may be substantial barriers within months. Several academic studies have emphasised that policy uncertainty is a major deterrent to trade, and the current Brexit negotiation period has been a good opportunity to test this.

It is a particularly good test because the Brexit vote came as such a shock: even on the day of the referendum, odds on Remain winning were about 9:2. A classic sign of surprise is the plunge of 10% to 15% in value of sterling against the dollar and euro within hours of the result.
In order to investigate the effects of the policy uncertainty and anticipation upon Britain’s exports and imports, we turned to the published monthly statistics for bilateral trade between the UK and 28 other countries (14 in the EU, 14 outside). These are currently available from 1999 to the first three months of 2018. We used these to predict what might have been expected to happen to the UK’s trade with each country in a counterfactual world where the Brexit vote had gone the other way.
A key assumption in our model is that the Brexit vote had a very strong shock upon trade flows involving the UK, but relatively little shock on flows which do not involve the UK. This allows us to compare how British trade levels have changed based on trade flows between other pairs of countries and, in doing so, we built a “synthetic doppelganger” for Britain’s trade in the months after the Brexit vote, using patterns of trade between other countries for unobservable shocks across countries such as changes in tastes and global business confidence. We also accounted for specific observable factors such as GDP and exchange rate changes.
Clear and consistent findings
We compared UK exports to and imports from each of the other 28 countries with a synthetic doppelganger. In all cases, the doppelganger and actual trade track each other closely up to the point of the referendum, after which there is a clear divergence.

For both UK exports to the EU and those to non-EU countries, we found a clear and consistent story: from the moment of the vote, British exports fall strongly behind the projected growth had there been no Brexit vote.
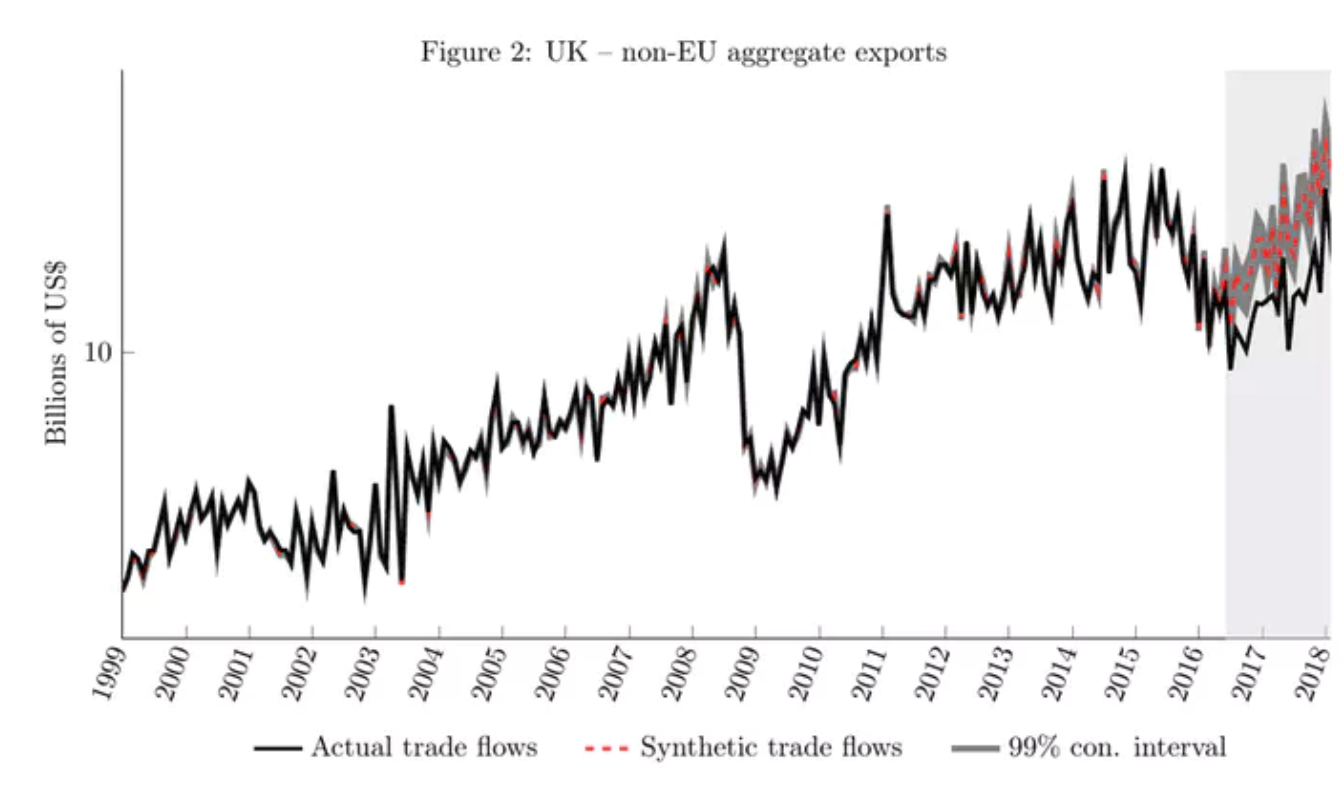
In both cases, the divergence is of a similar order of magnitude (8-13% before taking account of lagged exchange rate effects, or 13-16% without doing so). Interestingly, this is similar to the fall in sterling that followed the Brexit vote. This suggests that, through the fall in the pound, the UK started pricing its exports much more cheaply (in terms of dollars), but found few extra buyers, other than those we would have already expected, so the volume of exports moved in line with trade between our neighbours, but they were worth less due to the fall in sterling.
We also found commercial services exports – things like travel and tourism, transportation services, education, and banking, which are priced in US dollars – also stagnated for 18 months after the Brexit vote. This is at a time when world demand was growing.

In interpreting these poor export results, it is worth noting that there have been many reports of high export figures. But it’s important to recognise that these export numbers are measured in pound sterling and do not take into account the weakness of Britain’s currency. While there’s the appearance of a rise in exports, this is in large part due to the growth there’s been in global markets over the last couple of years.
Further, we argue that, since a significant amount of Britain’s exports are used to buy imports, what really matters is the value in terms of the currencies of our trading partners. If British exports sold can buy fewer imports, that translates to falling living standards at home, as imported goods rise faster in price than wages. Hence, Britain has lost a significant share in global markets (in terms of value) due to the uncertainties around Brexit, and is already poorer as a result.
This post represents the view of the authors and not that of the Brexit blog, nor the LSE. It first appeared at The Conversation and is republished under a CC-BY-4.0 licence.
Terence Huw Edwards is Senior Lecturer in Economics, Loughborough University.
Christian Soegaard is Lecturer in Economics, University of Warwick.
Dr Mustapha Douch is Research Fellow in Economics, Lloyds Banking Group Centre for Business Prosperity (LBGCBP), Aston University.


The critical point in this research is the model for constructing the “synthetic doppelganger”. I assume this is some kind of weighted average of countries other than the UK, but I don’t see many more details apart from “We also accounted for specific observable factors such as GDP and exchange rate changes”. Would it be possible to have some more details? For example, which countries were used, and what method was used to construct the weights?
It would also be interesting to know if effect remains if the original assumptions are varied, for example by altering the countries used, or the way the various methods used to “account for specific observable factors”.
Please bear in mind that this article is a nontechnical summary of two highly technical studies, both available as Warwick Economics Research Papers. I am please that you want to see more details of how the wotk was done (including some highly computationally intensive Monte Carlo robustness checks), but you will understand that thisxwas not suitable for a nontechnical summary.
@Terence: I’ve found one of the referenced papers.
https://warwick.ac.uk/fac/soc/economics/research/workingpapers/2018
and will try a non-technical summary of my own. You looked at the service exports of 27 countries, namely Austria, Belgium, Brazil, Czechia, Germany, Denmark, Spain, Finland, France, UK, Greece, Hun-
gary, Italy, Japan, Lithuania, Luxembourg, Malta, Poland, Portugal, Slovakia and the USA. You tried to model UK service exports pre-Referendum as a weighted average of the other 26, also building in exchange-rate variations. Your “doppelganger” is this model continued after the referendum. As checks you a. tried an alternative fictitious referendum date in 2014; b. hypothesising fictitious referenda in France and Germany. c. resampling (not quite sure how you did this. Naively it would be approximately equivalent to picking a sample of about 17 of the 26 countries and repeating the model construction over and over again).
To make it as non-technical as possible, you found that the UK’s service exports since the referendum are underperforming what you might from the other 26 countries.
What I miss is any explanation why those 26 countries were picked. The glaring omission for me is Ireland, but I also can’t see why you picked Lithuania and not Estonia, or Germany and not the Netherlands, or the USA and not Canada, or Brasil and not Russia. Did you choose the countries with a dartboard, or was there some system? How do we know the results would not have been quite different with a different selection of countries? Couldn’t you at least have got data for all EU countries from EUROSTAT?