
The coronavirus disease (Covid-19) originated in Wuhan, China in late 2019. By early April 2020, this infectious respiratory disease had been identified in over one million people worldwide, with nearly 60,000 attributed deaths, and with an expectation that millions will eventually die from the disease. Coverage of the resultant pandemic has focused on three main measures: the number of people who have tested positive for currently having the virus, the number of deaths, and the case mortality rate (which is the number of deaths as a percentage of those testing positive). For some groups the calculated case mortality rate has been very high, and some commentators have misunderstood that this number is not the same as the percentage risk of death for someone in a group.
These three common measures have some limitations. Very different testing strategies have been adopted around the world producing very different proportions of positive test. Some countries have done widespread testing, producing lower levels of positive results. Others have tested only hospital admissions, showing much higher ratios of positive results. Almost all testing detects whether you actively have covid-19; we await the anti-body tests which will determine if you have had the virus but are no longer actively infected. We know that results are affected by the fact that only a minority of randomly selected people test positive, and that of those who are currently infected 50% show no symptoms, with the majority of the rest having only mild symptoms. Given that different testing strategies produce very different levels of positive tests, the case mortality rate is of limited use in comparisons. In addition, most people are more interested in the overall chances of dying from the disease rather than the chances of dying having tested positive.
The crude measure of the number of deaths is also of limited use, despite graphs showing the number of deaths for many countries being widespread, including in government presentations. Plotting the number of deaths in the US (population 327 million) alongside Singapore (population 6 million) or Korea (population 51 million) has obvious problems. Obviously, epidemiologists adjust for this and it would be helpful for broader public discussion if, at a minimum, we considered, say, deaths per million of population.
There are issues with measuring deaths, including whether deaths occur from or with Covid-19, that deaths are later in the clinical pathway thereby reducing the number of data points, differences in measurement (for example whether it is hospital or all deaths), and most importantly whether the deaths are excess deaths or deaths some of which would have occurred in any case. Nonetheless, the death rate (and for now the expected death rate) is perhaps the key measure to use to examine alternative strategies. Evaluating those strategies will need to adjust for factors that are fixed and not driven by policy decisions in order to get to a true picture of how policy affected outcomes.
One of the most important factors affecting death rates is the age profile of different populations. Where we have age structure data and the size of the underlying population group, around 80% of deaths to date have been in the 70+ age group, and 92% have been in the 60+ age group. There is no obvious reason to expect that distribution to change as countries suffer more losses. Table 1 shows age data for deaths, using United Nations data for the size of population cohorts. Table 2 shows the same for countries that record different age bands but it shows a similar pattern. [Data as of 31 March 2020 for France, 31 March for Belgium, 2 April for England.]
Table 1. Deaths and underlying populations (ten-year age groups)
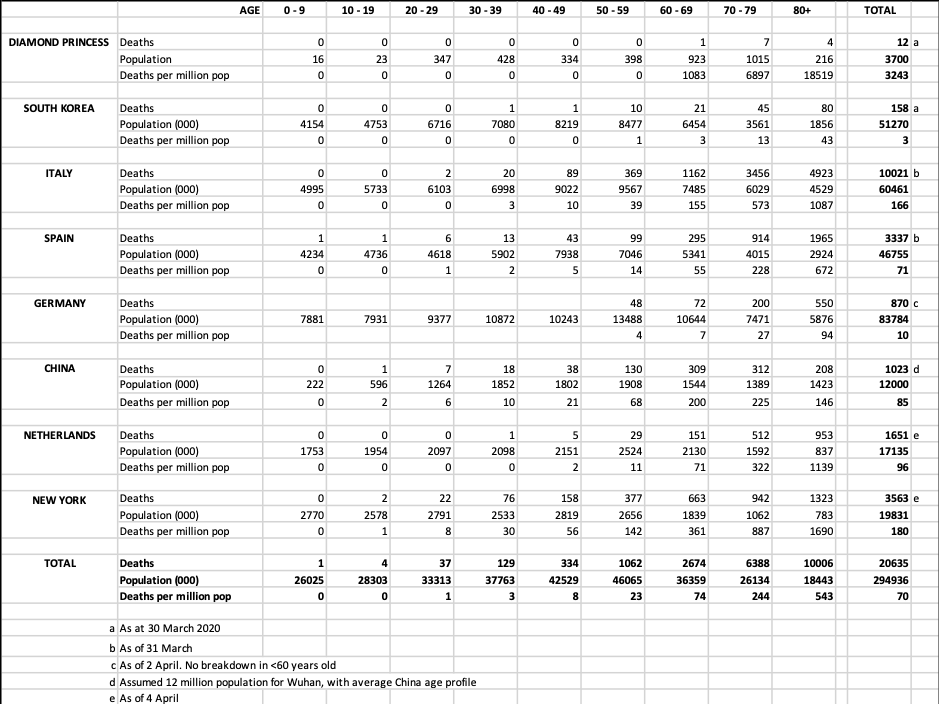
Source: Japan CDC, Wikipedia, Korea CDC (KCDC), www.epicentro.iss.it, www.mscbs.gob.es, China CDC, Riou J. et al ‘Adjusted age-specific fatality ratio during the Covid-19 epidemic in Hubei’ (www.medrxiv.org), Robert Koch Institute, Rijksinstitut voor Volksgezondheid en Milieu, CDC (US), NY State, UN Population Estimate
Table 2. Deaths and underlying populations (noted age groups)

Source: Epistat, www.rtbf.be, Sante public France, NHS England, PHE, United Nations
Given that we are in the midst of the pandemic, it is too early to draw final conclusions (although Diamond Princess, China and South Korea deaths may have plateaued) but we can see the very strong role played by age structures. And we can see the relative death rates for, say, those in their 60s versus 80s. With the odd exception of China, death rates for those aged 80+ are around three times those in their 70s. We can also see some boundary conditions emerging with Diamond Princess representing the worst outcome to date and Korea the best. One adjusted measure would be the risk of a person in their 70s dying. The deaths per million of population for this group vary from 13/million in South Korea to 573/million in Italy (as of end March), and at the extreme 6897/million on the Diamond Princess cruise ship.
Gender also plays a role. For these groups, where we have the data, 11,857 males and 8,276 females died (59% vs 41%). The drivers of gender differences will need further explanation. However, in cross country comparisons it is unlikely that gender mix is a key driver of different outcomes because the gender mix is broadly stable across countries (see Table 3).
Table 3: Gender ratios for >70 year-olds (various countries)

Source: United Nations World Population Prospects (2019)
We also know that we will need to adjust for comorbidity which will require data that identifies the causal link between the comorbidities and Covid-19. For example, in the US the proportion of adults with diabetes is very age dependent: 3% of 18-44 year olds, 14% 45-64, 23% 65-74, 21% 75+. Given the age profile we have seen it is no surprise that many of those dying of Covid-19 also have other age-related diseases. But there is limited analysis to date on how much these comorbidities increase risk in a population group. Other factors, which also have had very partial data availability, such as smoking, will also need to be examined as structural factors established prior to policy choices made.
When we come to evaluate the success of different policies we will have to adjust for other structural factors including intergenerational mixing, etiquette and social tactileness (kissing vs bowing), contacts per day, workplace characteristics, local transportation methods (crowded undergrounds versus personal cars). With a good measure, and a clear normalisation for structural factors, alternative policies for social distancing, quarantines, testing, travel limitations, hospital capacity etc can be properly assessed.
If the age profile holds broadly constant as the pandemic spreads, then it will differentially affect the challenge faced by countries. There are approximately 460 million people in the world over 70 years old. Of these, 341 million (70%) live in 20 countries: a mix of populous and richer countries. Table 4 shows these countries, indicating where Covid-19 might have the most extensive impact. Italy and Japan lead the list with the highest percentage of older people. China, India and the United States have the largest absolute older populations. If there is any good news at all, it is perhaps that, in general, poorer countries will have less of a pandemic shock than larger/richer ones.
Table 4. Number of >70 year-olds and percentage of population

Source: United Nations World Population Prospects (2019)
The age profile of Covid-19 deaths is very pronounced, making it important that demographics is included in evaluating disease progression and assessing policy responses. Without an understanding of these, and other, structural factors, cross-country comparison is of limited value. The impact of Covid-19 is likely to vary with country’s demographics, and this understanding can help policy choices such as required capacity levels. When the time comes to conduct cost-benefit analyses of the policy choices made, the age profile will have a profound effect on the evaluation of years of life saved. On a more immediate point, careful consideration is necessary as to what measures are most useful for the very broad communication beyond experts that has become common during this pandemic. The risk of unrepresentative measures is that there is confusion amongst the wide range of people whose behaviour is important as part of the solution to this pandemic.
Also by Neil Monnery:
♣♣♣
Notes:
- This blog post expresses the views of its author(s), not the position of LSE Business Review or the London School of Economics.
- Featured image by NickyPe, under a Pixabay licence
- When you leave a comment, you’re agreeing to our Comment Policy
 Neil Monnery studied at Exeter College, Oxford, and at the Harvard Business School. Between 1983 and 2004, he worked at The Boston Consulting Group as a director and senior vice president. He was group strategy director of WH Smith between 2004 and 2014 and chairman of Smiths News. He is a director at Ashridge Strategic Management Centre and author of Safe As Houses? A Historical Analysis of Property Prices (2011) and Architect of Prosperity: Sir John Cowperthwaite and the Making of Hong Kong (2017).


When I as a 62 year old male look at the age demographics I say let the young go back to work and let us take our chances
Let us imagine that (in the absence of the early availability of an effective vaccine) we wish to achieve herd immunity with the minimum of deaths. We are told that herd immunity is achieved at ~70% for the transmission rate for this virus. The great majority of the herd at risk of death are over 70 years old.
While maintaining “lockdown” for the rest of the herd we would send the under-9s away to Butlins (or some similar facility) without their parents for a holiday with the deliberate intention that they get the virus (if necessary seeding it) and come home 2 weeks later immune. [~12% of herd] [very, very few deaths]
We then send away our 10 – 19 year olds to the same facility with same intention and the same result. [~12.5% of herd] [very, very few deaths]
And then the 20 – 29 year olds. [~13.1% herd] [only a few deaths] – they are given certificates that allow them to recommence economic activity.
And then the 30 – 39 year olds. [not too many deaths] – more economic activity
etc. etc. till the 60 – 69 year olds have had their holiday and recommenced their economic activity, at which point about 76.5% of the herd will be immune and the part of the herd most at risk of death has been preserved in “lockdown”. They are (mostly) not economically active anyway and must await the arrival of an effective vaccine.
Why is no one looking at the pharmaceutical and environmental causes of compromised immunity?
Is COVID-19 a symptom and not a cause?
Can we possibly vaccinate against each “pandemic” as mutations occur? Wouldn’t strengthening, preserving and supporting the individual immune system be a higher priority?
I realize that in order to do this the bulk of currently prescribed pharmaceuticals must be abandoned, that diets must be changed and we must look to the safety and purity of our water and air, the effect of greenhouse gasses and EMF….but we are talking about survival of the species, aren’t we?
The Elephant in the Room.
What is the “Youth Factor” that protects the young who are infected with SARS-CoV-19 from getting COVID-19?
Knowledge of what this is (and I have a strong hunch) will provide an option to rejuvenate across the COVID-19 spectrum – shifting towards young. Mortality rate will be reduced across all ages. Exit will be de-risked.
LIF (a stem cell growth factor) is vital in protecting the lung in animal models of acute lung infection linked to acute respiratory distress (ARDS). LIF has been in clinical trials for a different indication proving safe. And LIF therapy would be fully compatible with other approaches (vaccines , drugs) to reduce severity of COVID-19. And effective per se – independent of viral type – because it acts to directly protect delicate lung tissues and repair any damage.
Can we find data on the age of non covid excess deaths ? This would allow us to see the excess life years lost in the pandemic. That is the most important metric. I suspect that there are more non covid excess life years lost than there are covid related. If that is correct, the net result of the lockdown has been to damage human life (as well as the economy and society). Therefore we really should know number.