Red meat consumption has seen a massive decline since the early 1980s in the UK. But the reasons are not just health and the environment. The increase in household labour supply and ready-meal habits have also contributed to the trend. Cesar Revoredo-Giha looks at the long-term trends and, given the negative impacts of processed foods both on health and the environment, calls for more practical guidelines for consumers.
Eating red and processed meat has become a target. Health professionals recommend eating less of it to prevent health problems such as cardiovascular disease, type 2 diabetes, and certain types of cancer. Environmental campaigners see meat production as an important contributor to global warming.
A recent article by a team at the Nuffield Department of Primary Care Health Sciences (University of Oxford) showed that average daily meat consumption in the UK decreased by approximately 17.4g per person (from 103.7g to 86.3g) between 2008/09 and 2018/19. This can be broken down in a reduction of 13.7g of red meat (from 37.4g to 23.7g) and 7.0g of processed meat (from 33.8g to 26.8g), along with an increase of 3.2g of white meat (from 32.5g to 35.7g).
The study used dietary data reported in the National Diet and Nutrition Survey (NDNS) rolling programme between 2008/09 and 2018/19, which captures nationally representative data on food consumption (as opposed to food purchases) within the UK. Dietary data is collected in the survey using four-day food diaries, and where meat was consumed as part of a preparation (e.g., as in cottage pie), the quantity of meat alone was estimated.
Changes in consumption do not suddenly happen and the study by Oxford shows how privileged the UK is by having datasets that enable researchers to carry out these long-term studies. In this sense, the purpose of this piece is to use another of these datasets, namely Family Food, run by the Department for Environment, Food & Rural Affairs (Defra), to explore what it says about long term trends in the consumption of meat and fish.
Family Food is an annual publication providing detailed statistical information on purchased quantities, expenditure and nutrient intakes derived from both household food and drink and eating out. Data are collected for a sample of households in the United Kingdom using (like the NDNS) self-reported diaries supported by till receipts of all purchases, including food eaten out, over a two-week period. An attractive feature of Defra’s publication is that it allows to see food purchases trends since 1974. This has been due to the amalgamation of three consecutive surveys: the National Food Survey (1940-2001), The Expenditure and Food Survey (2001-2007) and The Living Costs and Food (2008-now).
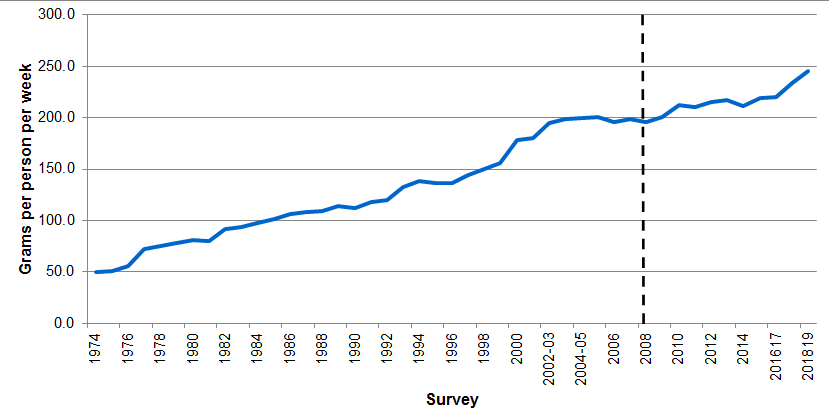
Figure 1 shows the evolution of six meat and fish categories: beef and veal, mutton and lamb, pork, bacon and sausages, uncooked poultry, raw fish, and shellfish. For comparison purposes, a dotted line was added indicating the period studied in the Oxford University article. It should be noted that the figures from Family Food are in grams per person per week (instead of per day as in the NDNS figure); in addition, these figures represent purchases rather than consumption (e.g., it doesn’t account for food waste). Nevertheless, the Family Food data have been used by researchers to explore consumption and nutritional trends (e.g., Foster and Lunn’s 40th Anniversary Briefing Paper: Food availability and our changing diet)
Aside from the actual numbers, the trends portrayed in Figure 1 agree with the results from the Oxford study, where the purchases of red meat products show a decreasing trend since 2008. Similarly, the considered processed product (bacon and sausages) shows a decreasing trend. The trend for poultry is not that clear, although the series showed a positive jump at the end of the considered period.
Where there is a difference between the two datasets, this is due to the purchases of raw fish and shellfish, which show a decreasing trend. This might be explained by the differences in the considered categories (e.g., NDNS includes fish and shellfish in prepared meals, which are not part of the data in Figure 1).
Figure 1. Purchases of meat and fish 1974-2018

Source: Department for Environment, Food & Rural Affairs (Defra) – Family Food Dataset. Note: The dotted line represents the starting point of the Oxford University article.
Something that the Family Food dataset adds to the NDNS-based study is that the trends appear to follow trajectories that started well before 2008. This is clear in the case of red meat, whose decrease in per capita consumption seems to start around the early 1980s. If we take the entire period considered in Figure 1, the purchase per capita of beef and veal decreased by 49 per cent; mutton and lamb, 78 per cent and pork, 48 per cent. In terms of the processed product, the decrease was 38 per cent.
The reasons behind the above massive reductions are, of course, not just due to the public health recommendations (see Foster and Lunn’s paper) but also have to do with changes in society, such as reduction of cooking due to several reasons (e.g., increase in household labour supply) or increasing presence of ready meals.
Figure 2, which considers the per capita purchases of ready meals and convenience meat and fish, reflects the previous point. In 2018 these purchases were almost five times the 1974 amounts.
Figure 2. Ready meals and convenience meat and fish products 1974-2018
Source: Department for Environment, Food & Rural Affairs (Defra) – Family Food Dataset. Note: The dotted line represents the starting point of the Oxford University article.
Implications
Clearly, there has been progress in reducing red meat purchases by households. However, how much more the reduction should go is not clear: whilst everybody agrees about the direction of travel, the use of percentages (e.g., cut meat and dairy intake ‘by a fifth’) is not useful unless the base of the change is given. In this sense, practical rules for consumers are needed (e.g., consume red meat only two days a week).
The increased consumption of ready meals captured by the data has implications both for nutrition (e.g., What are processed and ultra-processed foods?) and for the environment. As regards the latter, Andrew Opie, Food and Sustainability Policy Director of the British Retail Consortium, agreed that one of the most challenging areas for supermarkets to reach carbon neutrality was on the processed products that they were selling given the complexity of their supply chain.
♣♣♣
Notes:
- This blog post is based represents the views of the author(s), not the position of LSE Business Review or the London School of Economics.
- Featured image by Sander Dalhuisen on Unsplash
- When you leave a comment, you’re agreeing to our Comment Policy.