The Russian invasion of Ukraine led to electricity price hikes in Europe mainly because it made natural gas more expensive. Energy prices vary between countries depending on how much gas they use in their power mix. Miguel Gil Tertre, Ignacio Martinez, Manuel Rivas and Andreas Zucker write that countries with a larger share of renewables in the system were better protected against the crisis.
Russia’s aggression against Ukraine fundamentally changed the European Union’s energy landscape. Before 2021, more than 40 per cent of the natural gas imported by the EU came from Russia via pipelines. Since the start of 2023, the figure has fallen below 10 per cent. The weaponisation of supply by Russia significantly increased prices in 2022, resulting in very high natural gas prices. Although prices have stabilised at a lower level in 2023, they remain higher than their range from 2007 to 2021 and the spread of the EU vis-à-vis its trading partners has widened.
Gas-fired power plants often have the highest marginal costs needed to meet the demand for electricity, affecting many wholesale electricity markets in the EU. The increase in natural gas prices resulted in an increase of electricity prices in general, as gas acted as the marginal technology, setting the price for all electricity most of the time. This increase in electricity prices reverberated to all economic sectors, thus leading to an increase in inflation.
Relevant EU national markets that were traditionally exporters of electricity became importers. In the single market, electricity flows via price differentials, that is, countries with lower energy prices generally export it to its neighbours. Member states with a larger share of renewables in the system were better protected against the crisis. Those deploying renewables earlier will potentially enjoy a competitive advantage within the EU, which could become key to attracting industry. Energy price differentials are indicators of energy cost differentials, affecting the competitiveness of energy-intensive sectors exposed to international (and intra-EU) competition.
Figure 1. Monthly wholesale electricity prices in selected EU markets (before and after the energy crisis)
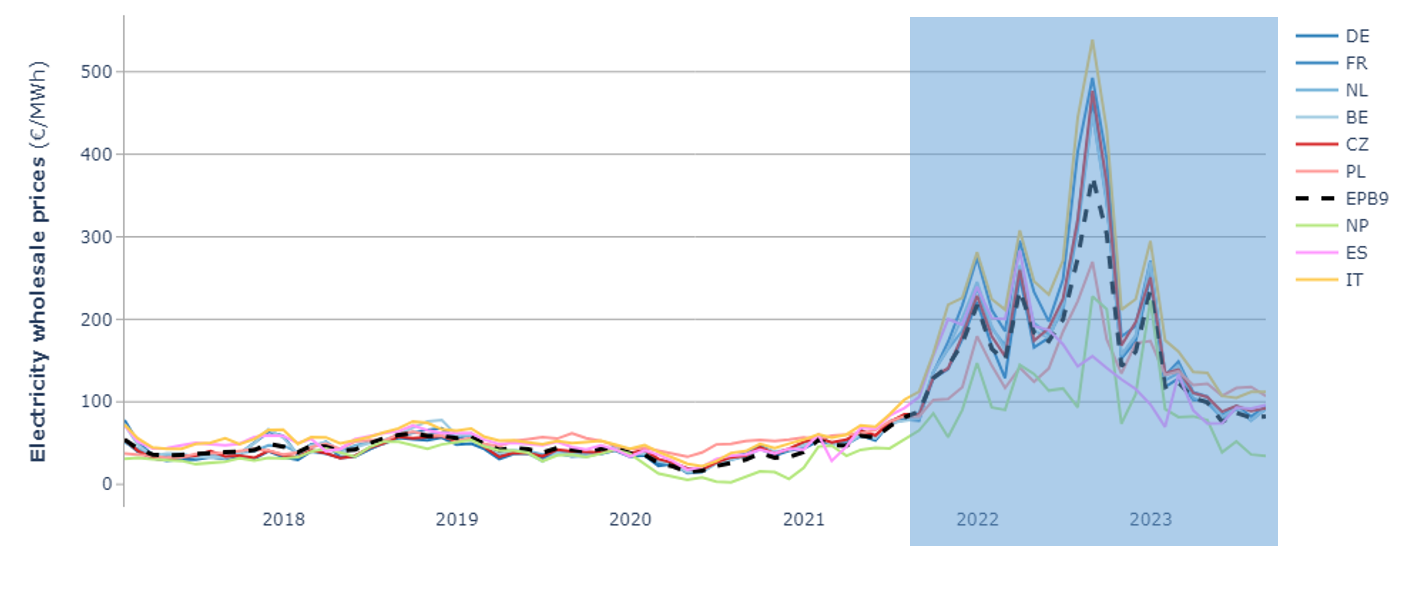
Note: The shaded area represents the rise of electricity prices due to the energy crisis and the post shock developments. Source: DG ENER Chief Economist Team based on ENTSO-E Transparency Platform, S&P Global Platts, Nord Pool, GME, TGE.
The impact of renewables
Since the beginning of the war in Ukraine, price differentials between main EU markets and regions have increased. The historical picture in wholesale prices has been changed. Our analysis shows the importance of renewable energy for prices (based on data coming mainly from ENTSO-E’s Transparency platform, complemented by data from S&P Global Platts and energy exchanges).
Nordic markets (mainly Norway, Sweden, Denmark and Finland) generally maintained the lowest wholesale prices in Europe thanks to the prominent role of hydropower and rising wind generation in the region.
Central Western Europe (Germany, France, Netherlands, Belgium ) moved closer to Nordic levels since 2018 due to rapidly rising renewable penetration and the solid performance of local nuclear capacities.
In the Iberian region, wholesale prices were consistently above the European average during most of 2018 and 2019, but they moved closer to that average in 2020 due to significantly expanded renewable generation and capacities, improved hydro generation and COVID-19-related lower demand.
In the Central and Eastern Europe region (Czech Republic and Poland), prices were close to the European average, but they have been rising in the last years. This is mainly due to coal and lignite generators constituting a large portion of the power mix and their higher costs due to higher carbon prices.
Italy traditionally displayed higher wholesale electricity prices compared to the EU due to the heavy presence of gas in their power mix and due to a relatively high reliance on imports.
Figure 2. Monthly wholesale electricity prices in the main EU markets (before energy crisis)
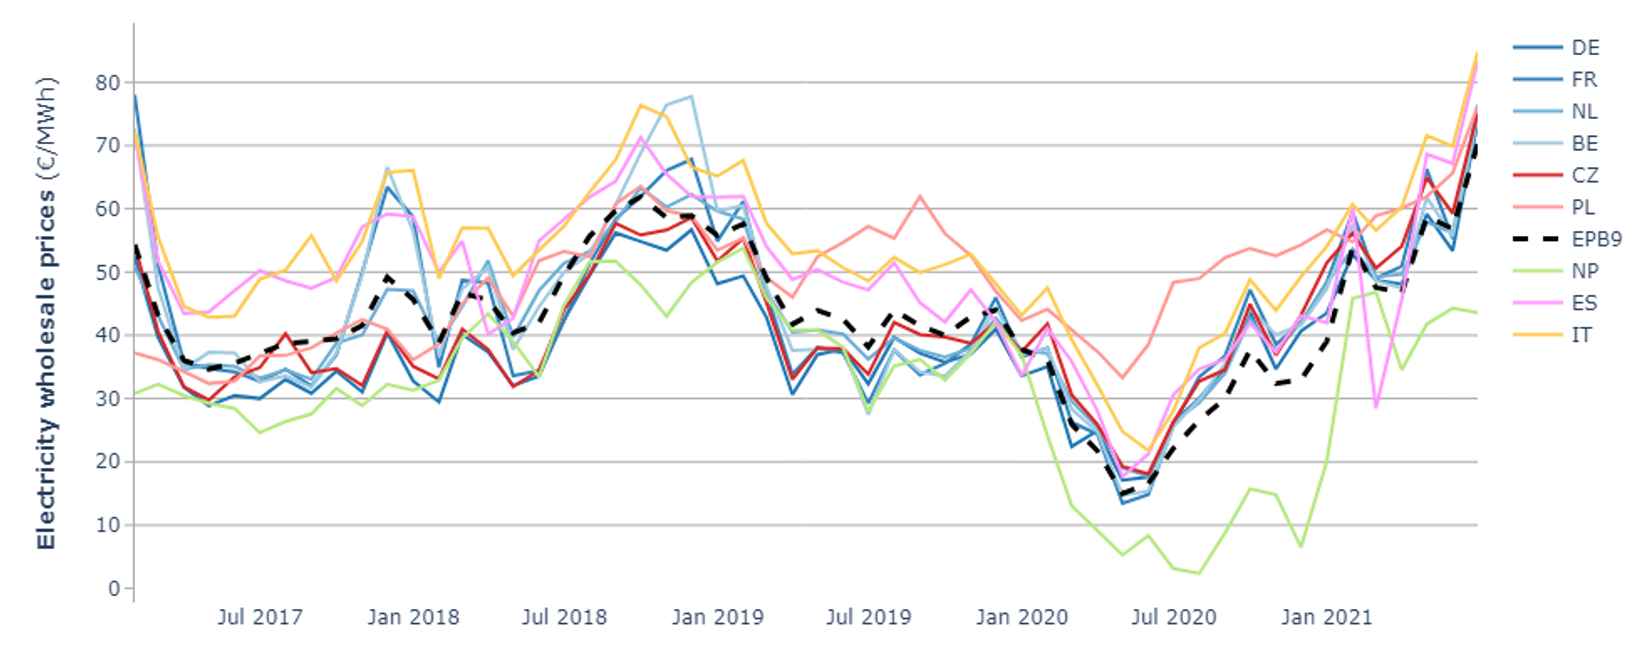
Source: DG ENER Chief Economist Team based on ENTSO-E Transparency Platform, S&P Global Platts, Nord Pool, GME, TGE
Figure 3. Price differential between selected pairs of bidding zones between 2017 and June 2021 (before energy crisis)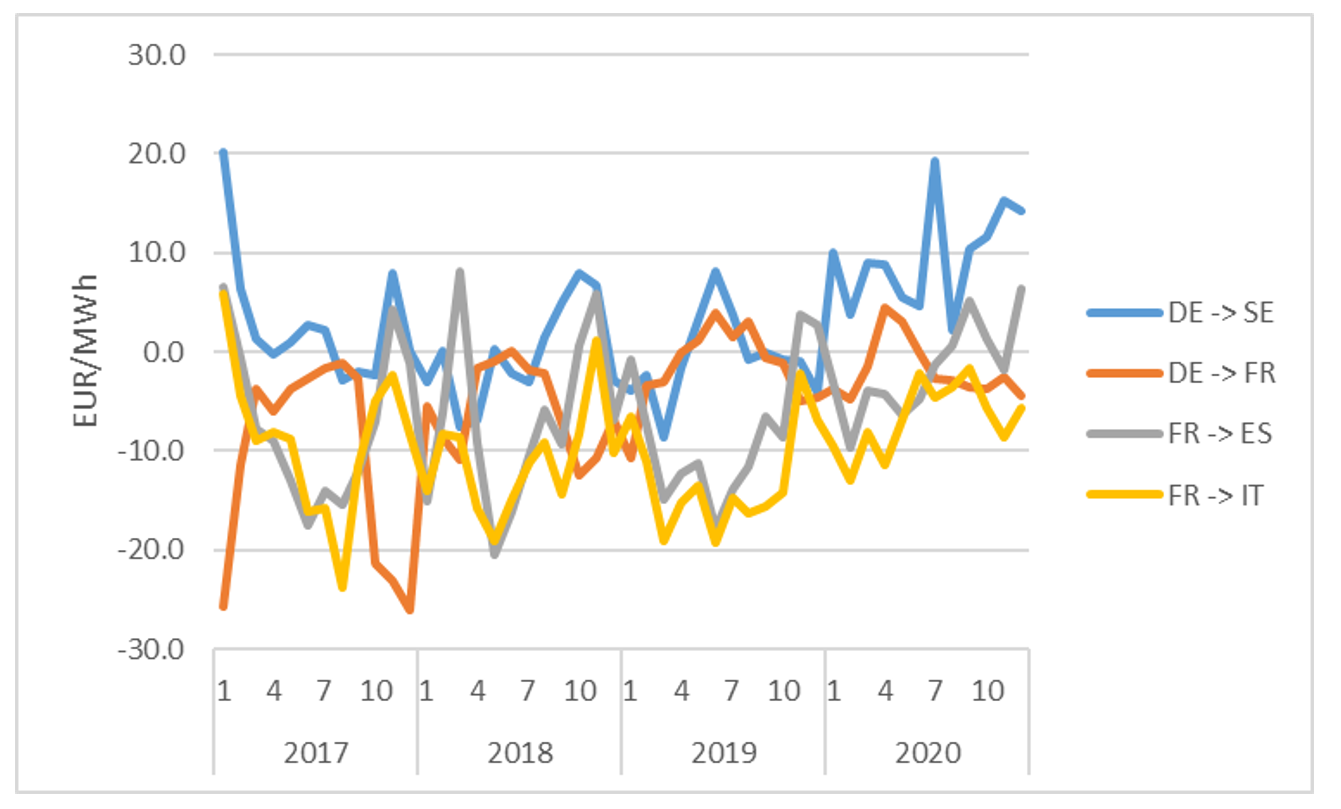
Source: ENTSO-E, ENER CET
Power mix
A higher price divergence between EU countries and regions is rooted in power mix differences. Prices in the Nordic market bidding areas, despite sharp rises, remained between 30 €/MWh and 90 €/MWh lower than in other European regional markets.
Central Western Europe prices increased to unprecedented levels (average monthly prices were above 450 €/MWh in August 2022, the peak of the crisis). Structural differences within member states in the regions were observed and significantly amplified in this period. The differential between French and German market prices remained roughly between 10 €/MWh and 45 €/MWh during this period. Prices were higher than usual in France because many nuclear power plants were under maintenance, and lower than usual in Germany because important wind generation met a significant part of the demand.
In the Iberian region, prices were higher than the EU average. However, two factors supported lower wholesale prices through most of the period: Spain’s large LNG import capacity and the ‘Iberian exception’, which came into force in mid-June 2022, in the form of an exceptional temporary cap on the price of gas used for power generation in the day-ahead markets. The goal of the “Iberian exception” was to mitigate the impact of soaring electricity prices on end-consumers. Since its implementation in June 2022, Spanish prices were between 10 €/MWh and 145 €/MWh lower than the EU average. This resulted in a rise in net exports of electricity from the region.
In Central and Eastern Europe (Czechia), prices followed the EU average, reaching all-time highs and being roughly 1 to 15 €/MWh above the EU average.
Italian prices were consistently on the upper bound of electricity prices in Europe during the crisis, between 30 €/MWh and 60 €/MWh above the EU average due to Italy’s large share of gas-fired generation and reliance on imports.
Figure 4. Weekly wholesale electricity prices in the main EU markets (during and after energy crisis)
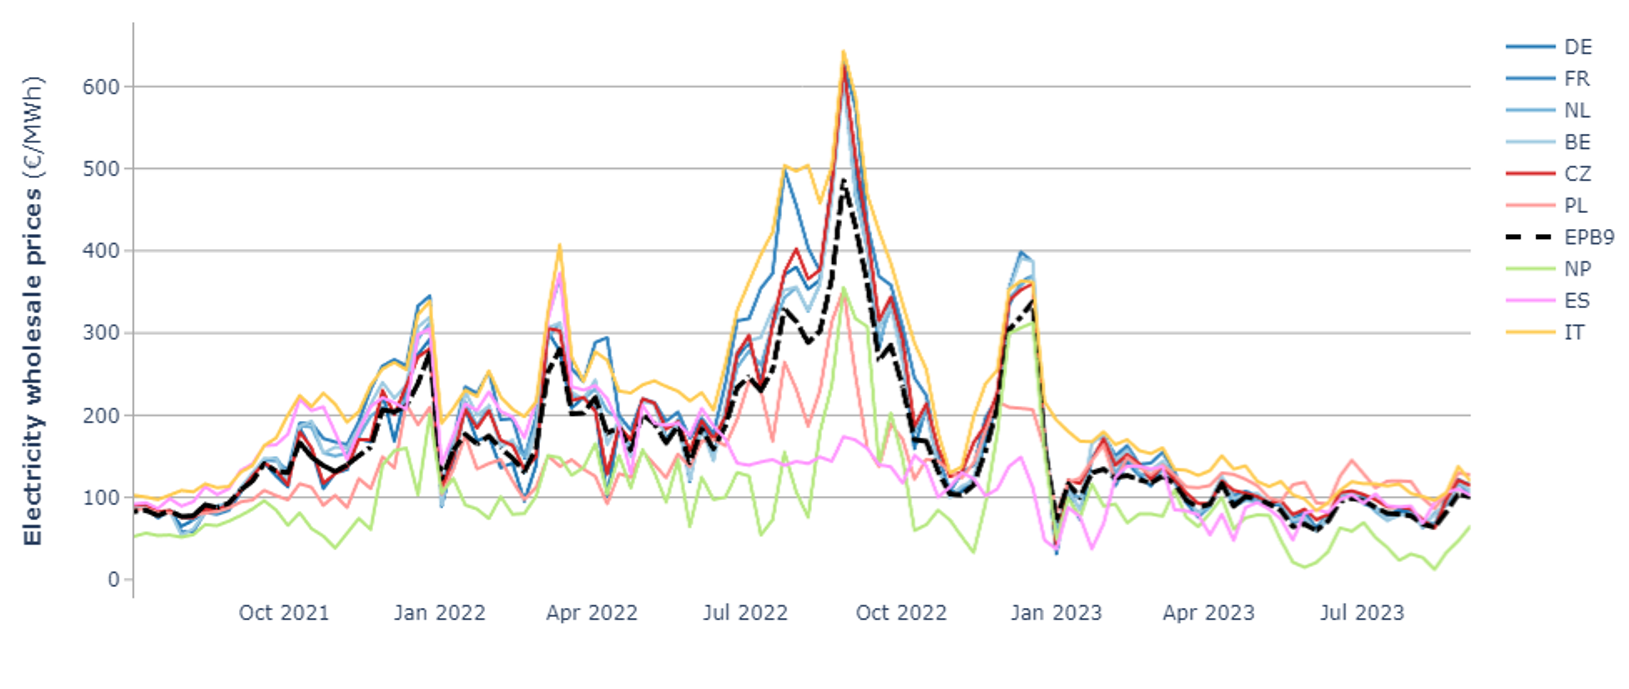
Source: DG ENER Chief Economist Team based on ENTSO-E Transparency Platform, S&P Global Platts, Nord Pool, GME
Figure 5 presents the evolution of average price differentials between selected pairs of bidding zones, between June 2021 and mid-September 2023, to show how price differentials were distributed during and after the energy crisis. When comparing it with Figure 3, it is possible to observe the magnitude of change in price differentials across Europe.
Figure 5. Price differential between selected pairs of bidding zones between June 2021 and mid-September 2023 (during and after energy crisis)

Source: ENTSO-E, ENER CET
Figure 6. Wholesale electricity prices in Europe – August 2023 average prices
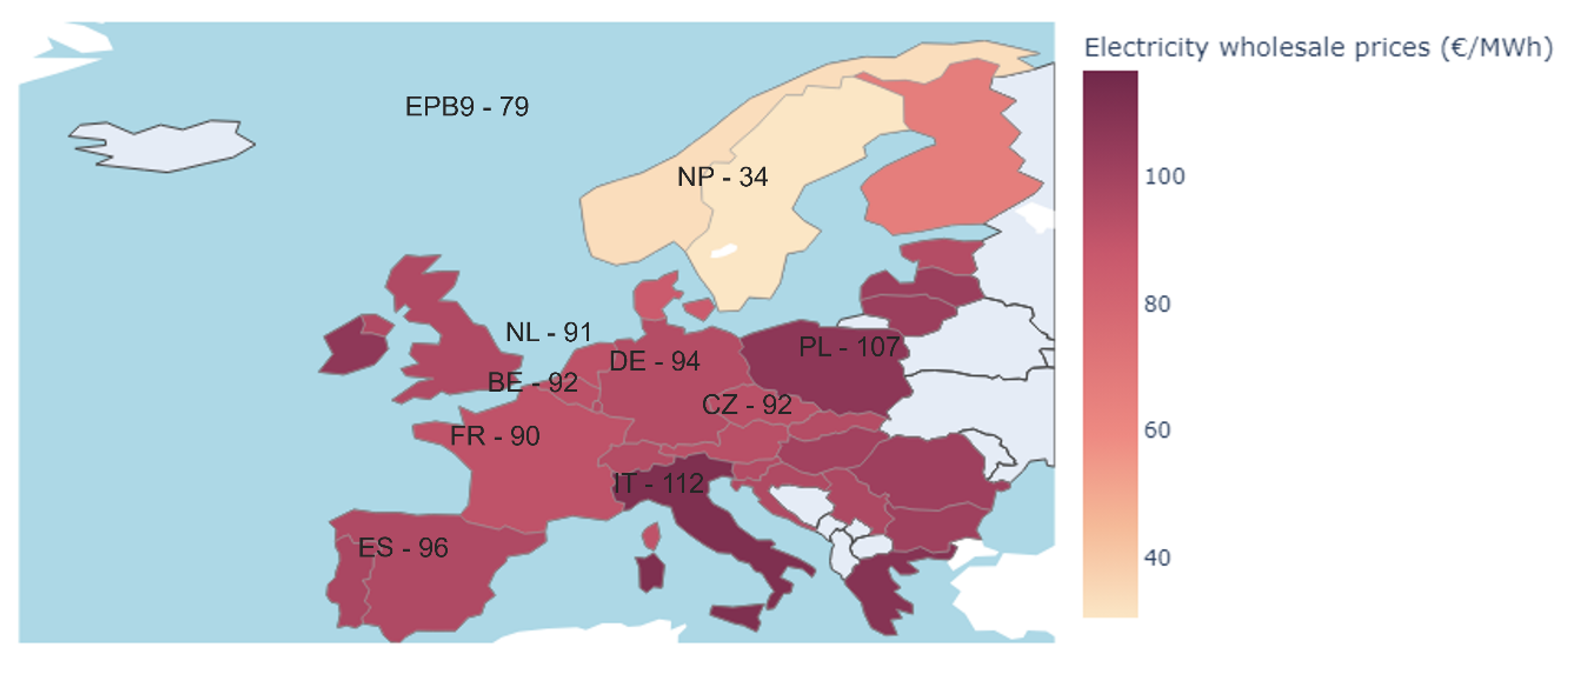
Source: DG ENER Chief Economist Team based on ENTSO-E Transparency Platform, S&P Global Platts, Nord Pool, GME
Conclusions
Member states such as Italy, which relies on a higher share of gas for electricity generation, pay higher prices compared to those that rely on other sources, as in the case of Nord Pool markets with hydro and wind.
The extraordinary rise in gas prices in Europe amplified divergences in wholesale electricity prices between those using more gas in electricity generation and those using less. Member states that introduced measures to limit the pass-through from gas to electricity (such as the Iberian exception in Spain and Portugal) had lower prices, especially during the worst moments of the crisis, when gas prices peaked at historical highs.
At the worst moments of the crisis, there were large differences in wholesale electricity prices in the EU, providing a competitive advantage to Spain and Nordic countries.
The price differential between France and Germany widened significantly from 2021 until they returned to historical levels in 2023.
Different power mixes can become a key factor in the widening of price differentials between EU member states and regional markets. The green transition will entail a large structural change of the power mixes towards a more sustainable, environmentally friendly renewables-based power mix. The different paces at which these changes will happen can result in further variation of the price differentials that could bring competitive advantages to those that deploy renewables earlier.
Trade with other member states in other regional markets can shorten potential price differentials. In that sense, the further deepening of the internal market, especially between market regions, can soften the impact of competitiveness on industry.
Authors’ Disclaimer: The views expressed are purely those of the writers and may not in any circumstances be regarded as stating an official position of the European Commission.
- This blog post is based on Structural changes in energy markets and price implications: effects of the recent energy crisis and perspectives of the green transition, written for the ECB forum on Central Banking, Sintra 2023.
- The post represents the views of its author(s), not the position of LSE Business Review or the London School of Economics.
- Featured image provided by Shutterstock.
- When you leave a comment, you’re agreeing to our Comment Policy.