 Sweden will hold a general election on 14 September. With one month to go until the vote, Anders Sundell presents two distinct forecasting models on the results: one based on the country’s economic performance and one based on opinion polling data. The results show that if the vote reflected Sweden’s economic performance, it would be expected that Fredrik Reinfeldt’s governing coalition would receive enough support to remain in power. However the opinion polling provides a different picture, suggesting that the government is in line to lose the election despite the economy.
The forecasting of elections in the United States has become a minor industry, highlighted by Nate Silver’s successes in the 2012 elections. In contrast, there have been virtually no attempts to forecast elections in Sweden. With the next Swedish general election due to be held on 14 September, I and Michael Lewis-Beck have therefore made an attempt to forecast the upcoming results. In a paper we put out in June, three months ahead of the election, we constructed two models, one based on economic variables and one based on opinion polls. The economy model predicted the reelection of the incumbent centre-right government, and the opinion poll model predicted defeat.
Why forecast?
As an initial point, it is worth asking what the motivations are for forecasting elections, as this has repercussions on the way in which a forecast is constructed. One reason might be simple curiosity: to know in advance how the election will turn out. If that is the case, we may use all available information and methods to produce a prediction that is as accurate as possible. Another reason may, however, be to learn something about electoral behaviour. If that is the case, some variables that have good predicitive power may be less valuable in the model. For instance, polls are usually a good indicator of election outcomes, especially close to Election Day, but they say little about why people vote the way they do.
Economic variables are on the other hand rooted in classic theories of voting behaviour. The general idea is that voters will reward an incumbent government if the voters’ economic situation has improved during the term. Ronald Reagan made it explicit when in a debate during the 1980 US presidential election campaign he asked viewers ”are you better off now than you were four years ago?”
While simpler economic models in some cases are less accurate, it perhaps says something interesting about democracy if election outcomes can be reasonably well predicted from some basic facts about the economy. And if the prediction is off, we can at least know that factors other than the economy seem to have decided the election. In our paper we therefore primarily aimed to produce a structural forecast model. We do however also include a simple polling model, as a baseline.
Constructing the models
Most forecast models have been developed in the context of US presidential elections, where there only are two competitive parties. In contrast, the Swedish eight-party system poses a challenge when deciding how to measure support for the incumbent government.
Centre-right prime ministers, including the current incumbent, Fredrik Reinfeldt, have often formed coalitions where several parties are represented in the government. Social democratic prime ministers have instead only included the Social Democrats in the government, but have relied on the support of the Left Party and more recently the Green Party to pass legislation. Our strategy has been to measure the vote share for government and support parties. For instance, even if the Left Party have never been included in a Social Democrat government, a vote for the Left Party has always meant a vote for a Social Democrat prime minister, and thus a continuation of Social Democrat policy.
To determine which variables to use for predicting the support for the government and support parties we investigated the correlations between a host of economic indicators and all outcomes in Riksdag elections between 1973 and 2010. We settled on two: the change in the level of unemployment during the term, and the average inflation during the term.
Unemployment is usually one of the dominant themes during election campaigns, and is consistently ranked by voters as one of the most important political issues. This election is no exception, as both Reinfeldt’s Moderate Party and the Social Democrats have dubbed it the primary issue. The prime minister has argued that his coalition have the best solutions for creating jobs and boasts that 250,000 jobs have been added during the term.
Inflation is a less obvious candidate for the model. There is no doubt that it has been an extremely important issue in Swedish politics, especially during the 1970s and 1980s when, in several years, it exceeded ten per cent. Since 1999, however, the central bank has been independent and has (zealously) kept inflation around or below the two per cent target. High inflation is thus currently a non-issue in the Swedish political debate. However, the government has relied on a message of ordinary people getting ”more in their wallets” as a result of their policies, most notably a lower income tax. High inflation would have undercut this message. Given that inflation is also expected to be connected with the unemployment level (the so-called Phillips curve), we decided to include it in the model.
For our polling model, we simply used the vote share of the government and support parties in the May poll done by the SIFO institute as our only variable. Notably, there is a clear tendency toward regression to the mean: governments that received large support in May usually lost in the months before the election, and vice versa.
Our predictions
Are Swedes better off now than four years ago, then? According to our variables, not particularly, but they are not much worse off either. Unemployment has remained stable, and inflation has been extremely low, bordering on deflation. Therefore, the forecast produced by our structural model is very positive for the government: 49.7 per cent. The problem is that unemployment has remained stable at a high level, in the wake of the global economic crisis.
Chart 1 shows the expected and actual levels of support for government and support parties in all Riksdag elections since 1973 based on the economy. Of special interest is 2010, when the current government was reelected. As the dot is high above the diagonal, the government ’overperformed’ in relation to what would be expected from the state of the economy. The reason is of course the global economic crisis, which voters naturally did not attribute to the government. Instead, the government’s handling of the crisis has garnered praise and was an important factor in its reelection. But as they overperformed relative to the model in 2010, they may now underperform, as many expected a stronger recovery after the crisis.
Chart 1: Actual vote share for incumbent Swedish governments in general elections and the vote share which would be predicted by the country’s economic performance
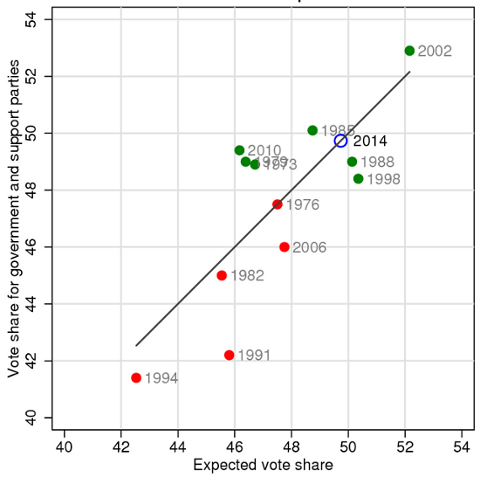
Note: The vertical axis shows the actual vote share received by the incumbent government (and its support parties) in Swedish general elections. The horizontal axis shows the vote share that we would expect the government to have received if it reflected the country’s economic performance. Dots which are above the diagonal line indicate the government ’overperformed’ relative to the economic performance, while those below the line indicate the opposite. Green dots show cases where the government was re-elected.
Indeed, our polling model shown in Chart 2 predicts an entirely different result: 43.4 per cent of the vote, which most likely would spell defeat for the government. The polls have for long now been grim reading for the government, and the coalition only received 38.7 percent in the May SIFO poll, a truly catastrophic result if it were to come true on Election Day. Also note that the dots are clustered closer to the diagonal, which means that the model fit and predicitve power is better than in the structural model.
Chart 2: Actual vote share for incumbent Swedish governments in general elections and the vote share which would be predicted by opinion polls
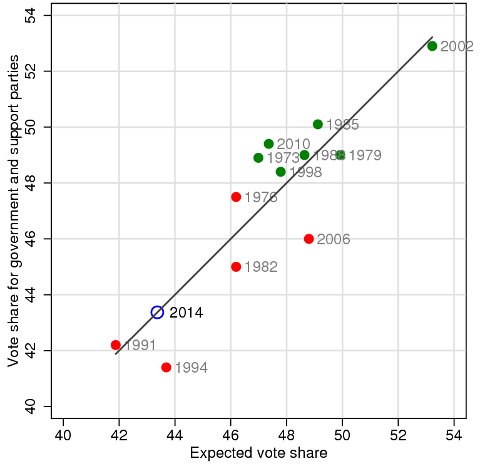
Note: The vertical axis shows the actual vote share received by the incumbent government (and its support parties) in Swedish general elections. The horizontal axis shows the vote share that we would expect the government to have received if it reflected opinion polling. Dots which are above the diagonal line indicate the government ’overperformed’ relative to the polls, while those below the line indicate the opposite. Green dots show cases where the government was re-elected. The 2014 figure reflects the polling situation in May 2014.
When we made our forecast two months ago, both predictions seemed optimistic given the state of the polls. This is even more the case in August, as the government has failed to recover any ground during the summer. In the latest SIFO poll, shown in the Table below, the government received 38.9 per cent, 5.5 percentage points below our polling model prediction. Many voters are still undecided, and the peak of the campaign remains. Experience does however show that large swings in the end are uncommon.
Table: Latest SIFO poll for the 2014 Swedish general election (9 August)
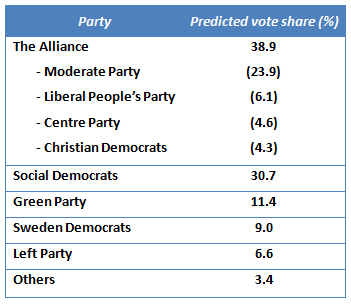
Note: Poll was published on 9 August by SIFO with fieldwork conducted from 4-7 August. The vote shares for the four parties which make up the governing ‘Alliance’ are shown together for ease of reference. For more information on the parties see: Moderate Party; Liberal People’s Party; Centre Party; Christian Democrats; Social Democrats; Green Party; Sweden Democrats; Left Party.
The economic model prediction is therefore unlikely to come true, and we will of course evaluate the model after the election. But even if the government is defeated, our model tells us something: the centre-right government won in 2010 despite the economy; it now looks set to lose in 2014, despite the economy.
Please read our comments policy before commenting.
Note: This article gives the views of the author, and not the position of EUROPP – European Politics and Policy, nor of the London School of Economics. Feature image credit: Christopher Neugebauer (CC-BY-SA-3.0)
Shortened URL for this post: http://bit.ly/1rbnQcy
_________________________________
Anders Sundell – University of Gothenburg
Anders Sundell is a PhD Candidate at the Department of Political Science and Quality of Government Institute at the University of Gothenburg.

1 Comments