Citizens in some EU member states are given the opportunity to select their preferred candidates when voting for parties competing in European Parliament elections. But do these systems actually result in meaningful differences in the allocation of seats? Drawing on newly collected data, Thomas Däubler and Mihail Chiru explore the impact preference votes have on the composition of the Parliament.
Elections to the European Parliament are an impressive exercise of popular sovereignty. In 2019, over half a billion people from across 28 member states chose their representatives, who together constitute one legislative body. The EU treaties specify that MEPs are elected ‘by direct universal suffrage in accordance with a uniform procedure in all Member States or in accordance with principles common to all Member States’.
At first glance, this suggests that the casting of votes and allocation of seats occur in a similar way across member states. That is true in one sense: since the European elections of 1999, member states are required to apply electoral rules that allocate seats between parties in correspondence to their vote shares (either using a proportional representation formula or the single transferable vote system, which produces a fairly proportional vote-seat translation in practice). On the other hand, there is no uniformity when it comes to the choice of candidates within parties. Whether voters can express preferences among candidates of the same party and the extent to which this influences who will receive a seat varies widely.
Figure 1: Ballot structure in European Parliament elections, 2014
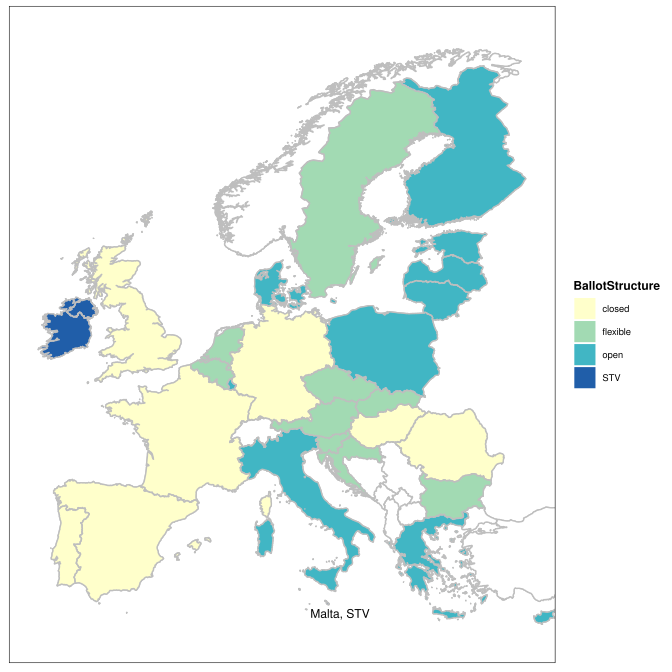
Note: Map drawn using the R package eurostat. © EuroGeographics for the administrative boundaries.
We can distinguish between four broad types of electoral systems that are used in European Parliament elections. Their prevalence – as of 2014 – is shown in Figure 1 (data are from Thomas Däubler and Simon Hix). Seven member states, including several of those with large populations, use a closed-list system that does not give voters any within-party choice at all. Citizens can merely choose between teams of candidates that are pre-determined by the parties.
In contrast, in 13 countries (ten with open lists and three using the single transferable vote system), citizens can express at least one preference for a candidate, and these preferences alone determine which candidates from a party are elected. Seven member states make use of so-called flexible lists. Here, parties also provide ranked lists, but candidates can ‘jump the queue’ if they receive sufficient voter support (this is usually operationalised with a legal threshold that specifies a certain percentage of the total party vote).
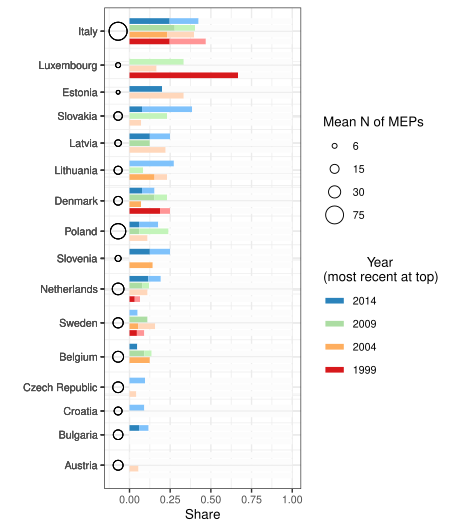
Figure 2: Preference vote use across countries, across parties and over time

Note: Small circles show parties, larger solid points show the mean across parties. The figure shows elections in which citizens had one optional preference vote. For Bulgaria (2007) and Croatia (2013), election years refer to the previous main European Parliament election year.
There are additional sources of variation. Formally, where candidate voting is used, it can either be a requirement to choose a candidate or citizens may opt out by casting a party vote. In practice, we observe considerable differences in the take-up of preference voting between countries that make it optional. Figure 2 shows information from a new dataset that provides Comprehensive European Parliament Electoral Data (COMEPELDA – accompanying article here) covering rules, parties and candidates. The graph displays preference vote take-up rates in the 1999-2014 elections for member states that use one optional candidate vote (the larger points are country-election means and the smaller circles refer to individual parties).
Citizens’ use of preference voting does not vary much over time (although Sweden is a bit of an exception in this regard), but it does across countries. Approximately three out of four voters express a preference for a candidate in countries like Slovenia or Denmark, but only one in eight in Austria. To some extent, the take-up of optional candidate voting may reflect the impact of these votes on actual seat allocation, which in flexible list systems can give rise to a chicken-and-egg problem. If few candidates are seen to ‘jump the queue’, citizens may be less likely to choose one. However, low candidate voting rates may also reflect the fact that most voters simply agree with the party ranking, which may have anticipated voter preferences.
The question of whether preference votes ‘really matter’ is a tricky one to answer. One approach consists of looking at how frequently MEPs are elected from list ranks – in systems with flexible or open lists – that would not have gained them a seat under closed-list rules. For example, if a party wins three seats, are there any MEPs whom the party itself had not ranked among its top three prior to the elections? Such rates are shown in Figure 3.
While this is not a particularly frequent phenomenon in relative terms (and many of the countries to which this logic can be applied have a fairly low number of seats), it happens with some regularity in a couple of member states. In particular, at least four out of ten Italian MEPs typically fall into this category. If we take into account the fact that parties may find it difficult to predict the number of seats they will win when nominating their candidates and apply a stricter criterion (list position at least three ranks below the number of seats won, shown with darker colours) for ‘surprise’ MEPs, the numbers are smaller but still non-negligible.
Figure 3: MEPs owing their election to preference votes
Note: Data refer to MEPs initially elected. For Bulgaria (2007) and Croatia (2013), election years refer to the previous main EP election year.
MEPs represent citizens, but they are also members of national parties and transnational European party groups. Aspects such as the topics they work on, the positions they take, or who they are accountable to may also depend on electoral incentives and therefore on the modes of election. From a political science perspective, the European Parliament provides fertile ground for examining such effects.
The COMEPELDA collection will hopefully facilitate further research in this area. The wide variation of PR systems we observe in the European Parliament is actually useful for examining whether institutional design matters. This will help in finding out which electoral rules may be the best to consider for a more uniform procedure of electing MEPs in the future.
For more information, see the authors’ accompanying paper (co-authored with Silje SL Hermansen) at European Union Politics
Note: This article gives the views of the authors, not the position of EUROPP – European Politics and Policy or the London School of Economics. Featured image credit: CC-BY-4.0: © European Union 2021 – Source: EP