In this article originally published by the Center for Global Development, Professor in Practice in LSE Department of International Development Mark Lowcock and CGD colleagues Ian Mitchell, Sam Hughes and Samuel Pleeck look at how humanitarian crises all over the world are being created or exacerbated by the war in Ukraine. As focus continues to be directed towards Ukraine, the authors argue that steps must be taken to ensure sufficient aid is allocated to other states facing potentially disastrous humanitarian consequences.
International focus is understandably on the shocking return of armed conflict in Europe. But alongside that crisis, there are already dire humanitarian crises around the world which are being exacerbated by price spikes in oil and food. There will be dire consequences for millions of people who depend on humanitarian support if the international community neglects the conflict’s wider risks by only responding to the immediate crisis in Ukraine.
In this blog, we take a critical look at humanitarian needs around the world, consider how heightened food and energy prices are exacerbating those crises, identify existing and new countries at risk, and look at the major donors’ resources to respond to those needs. We find that resources and attention are being diverted to Ukraine, rather than expanded, and argue that policymakers must recognise the severity of the crises beyond Ukraine and take urgent steps to avert human suffering and contribute to stability.
Despite economic recovery and a decade of economic growth, humanitarian needs have only grown
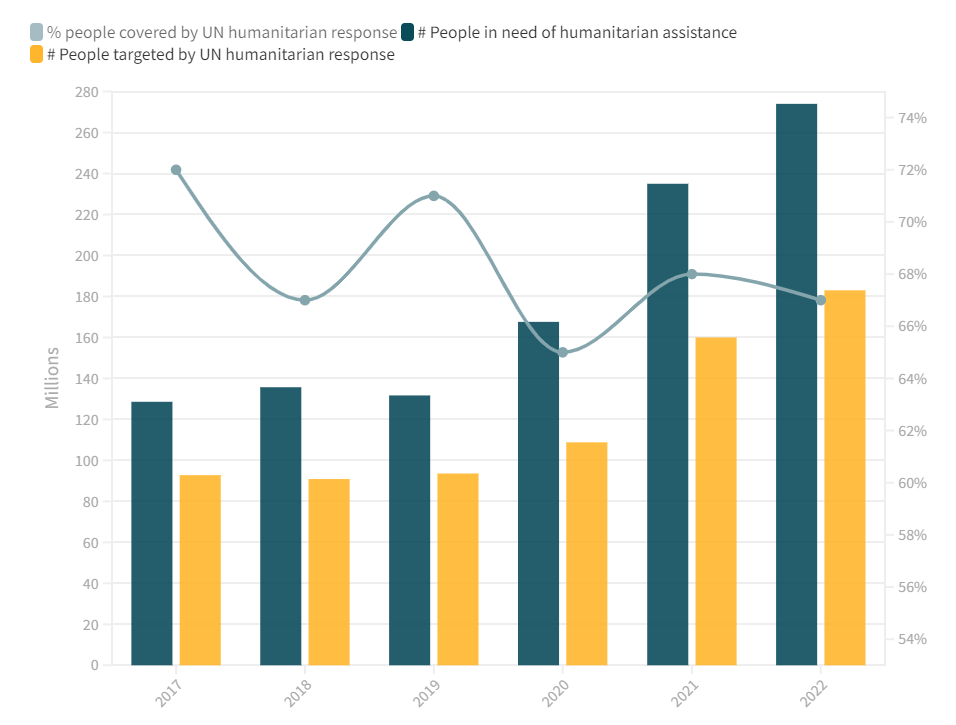
Although global extreme poverty continued to fall steadily until COVID-19 hit, the number of people facing acute risks to their welfare increased over the last decade. In the last decade, the unresolved conflicts in Syria, Libya, and Yemen, grave ongoing problems in the Horn of Africa, a sharply deteriorating situation in the Lake Chad Basin and central Sahel, and high levels of ongoing need in the Democratic Republic of the Congo (exacerbated by repeated Ebola outbreaks) have sent humanitarian needs to new highs. More recently, the war in northern Ethiopia, the collapse in Afghanistan, and now the invasion of Ukraine have only added to the number of crisis spots. Analysis of the UN’s annual humanitarian overview report from 2017 to 2022 makes clear the rising trend in people in need. COVID has made things worse in the most vulnerable places, and added others to the UN’s list of humanitarian focus countries. But the trend predates COVID and is driven mostly by conflict and climate change.
Figure 1. Global humanitarian assistance needs and UN humanitarian response, 2017-2022

As Figure 1 illustrates, UN humanitarian responses have not kept up with growing need. The ratio of people in need covered by UN response plans declined from 72 percent in 2017 to 67 percent in 2022, including a historic low of 65 percent in 2020. Since 2020, the socioeconomic impacts of COVID-19, combined with conflict and a spate of extreme climate events, have raised the number of people at risk of famine. These needs are highly concentrated: In 2022, half of the people in need of humanitarian assistance are in just ten countries (Afghanistan, DRC, Ethiopia, Nigeria, Pakistan, Sudan, South Sudan, Syria, Venezuela, Yemen).
As the number of people in need of humanitarian assistance more than doubled in the last six years, financial appeals by the UN followed a similar growth path, increasing from $24 billion in 2017 to $43 billion in 2022. The international community has struggled to match this rise in need and the share of those appeals that have been met by donors dropped from 62 percent in 2017 to 50 percent in 2021.
How will the crisis in Ukraine affect global humanitarian needs?
Humanitarian responses in Ukraine have focused on support for those fleeing to become refugees (primarily in neighbouring countries), people displaced inside the country (mostly moving from areas in the east affected by fighting to safer locations further west), and civilians trapped and unable to escape the violence. Little help has so far reached those in the last category, largely because the Russians have failed to provide relief agencies with the normal guarantees of safe access.
So far, most of the burden has been shouldered by public bodies and host families in neighbouring states. But the UN, Red Cross, and international nongovernmental organisations (NGOs) are scaling up quickly. Substantial amounts have been pledged, with the US alone announcing over $5 billion.
But there are two causes for concern. First, there are the spillover effects from the price spikes in food and oil and the effect of economic sanctions; and second, humanitarian aid is being diverted to Ukraine from other places, which risks making the situation in those places even worse.
Rising prices, sanctions, and spillover effects threaten some countries
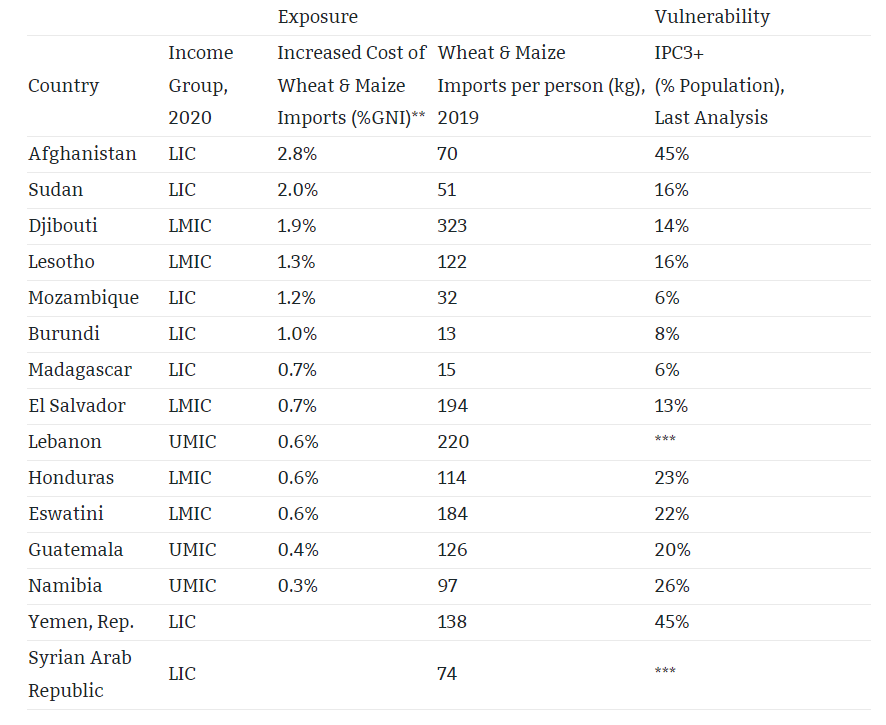
Not all countries are equally exposed or vulnerable to the wider food security impacts of the invasion of Ukraine. Identifying these countries is important to prioritise support. Here we consider low- and middle-income countries that are exposed to the rising cost of grain imports, and then further filter this list to those which are also vulnerable due to pre-existing food insecurity.
We identify countries with significant exposure as those who would have to spend at least an additional 0.5 percent of gross national income (GNI) to maintain their levels of wheat and maize imports despite rising prices. An alternative criterion is also used: annual wheat and maize imports exceeding 50kg per person (equivalent to almost 500 calories per day). This captures additional countries which are significantly dependent on grain imports for survival, even if the rise in costs of these imports are less macroeconomically significant.
We also measure vulnerability as the share of the population already living under conditions of acute food insecurity, according to the Integrated Food Security Phase Classification (specifically at phase 3 or higher: “IPC3+”).
Table 1 below presents these exposed and vulnerable countries. It highlights 15 countries that are exposed to rising global grain prices and are known to have a population already facing acute food insecurity (11 of which are additional to the ten countries with the greatest humanitarian need already listed above).
Table 1. Low- and middle-income countries exposed* to rising grain prices and vulnerable with pre-existing food insecurity
* Exposure to rising global grain prices is defined as either: (i) annual combined wheat and maize imports ≥50kg per person (equivalent to almost 500 calories per day, assuming 3500 calories per kilogram of grain; note the L/MIC median is 52kg); or (ii) an increase in the cost of wheat and maize imports ≥0.5%GNI, assuming no change in quantity imported (capturing the upper quartile of L/MICs).
** Due to the 71% rise in the price of wheat and 29% rise in the price of maize between 2021 and March 2022.
*** Lebanon & Syria are missing IPC data, though they are known to have significant populations living under food insecurity.
Sources: FAOSTAT Food Balances, World Bank Pink Sheet (April 2022), World Bank World Development Indicators, IPC Population Tracking Tool
Note: Some countries of concern are missing the import data needed to assess exposure, including Eritrea, Palestine, Somalia, and South Sudan.
Yemen and Afghanistan already face major humanitarian emergencies, and are now also exposed to rising grain prices. But beside those well-known cases are similarly exposed and vulnerable countries which may be overlooked. In Namibia, a quarter of households were assessed last October to be in urgent need of action to reduce malnutrition and protect livelihoods. In Central America, El Salvador, Honduras, and Guatemala are also highly dependent on grain imports, and significant shares of their population already face acute food insecurity. Smaller African countries like Djibouti, Lesotho and Eswatini are in a similar position, but risk escaping the notice of the international community.
Identifying countries that are vulnerable due to debt distress or fiscal constraints
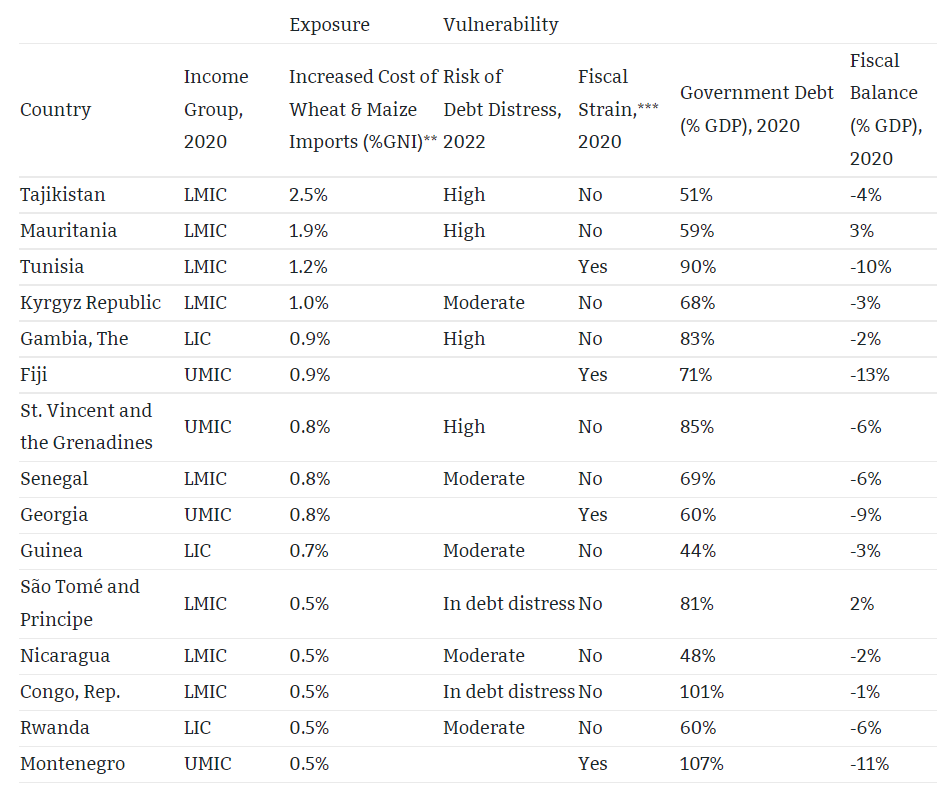
An alternative lens to look at the vulnerability of countries exposed to sharp increases in food prices is whether they have the fiscal space to adequately respond to the crisis. Below we present countries macroeconomically exposed to rising grain prices, yet which we consider to have limited fiscal space based on the IMF’s Debt Sustainability Analyses or our own stylized measure of ‘fiscal strain’.
Egypt’s exposure to imported wheat and its implications for government expenditure are well-understood, and the IMF and Saudi Arabia have provided support. But our analysis identities 15 other low- and middle-income countries with macroeconomic exposure to rising grain prices and fiscal challenges. Table 2 presents those countries with an increase in import costs of over 0.5 percent of GNI and which are either at risk of debt distress according to the IMF or are facing ‘fiscal strain’ (which we define as above-median government debt and a fiscal balance in the top quartile, limiting their ability to respond fiscally).
Table 2. Other low- and middle-income countries exposed* to rising grain prices and vulnerable with limited fiscal space
* Exposure to rising global grain prices is here defined as an increase in the cost of wheat and maize imports ≥0.5%GNI, assuming no change in quantity imported (capturing the upper quartile of L/MICs). Note that an additional 13 L/MICs which do not meet this exposure criteria still have annual combined wheat and maize imports ≥50kg per person and either a risk of debt distress assessed to be moderate or greater, or are assessed to be facing fiscal strain. The full analysis is linked to below in this blog.
** Due to the 71% rise in the price of wheat and 29% rise in the price of maize between 2021 and March 2022.
*** In order to cover countries whose risk of debt distress is not analysed by the IMF, fiscal strain is here defined as above median government debt (≥60%GDP) combined with a fiscal balance in the top quartile of concern (≤-9%GDP).
Sources: FAOSTAT Food Balances, World Bank Pink Sheet (April 2022), World Bank World Development Indicators, IMF List of LIC DSAs for PRGT-Eligible Countries as of January 31, 2022, World Bank: A Cross-Country Database of Fiscal Space
These countries may face challenges in providing social support to their populations in response to price increases. Four countries with fiscal challenges can expect price increases of 1 percent of GNI or higher, and the IMF considers two of these as at high risk of debt distress: Mauritania and Tajikistan. For the latter, remittances are also projected to decline by 3.4 percent of GDP in 2022 as result of sanctions on Russia, further exacerbating food security concerns there.
All told, we identify the top 15 countries whose acute humanitarian needs are likely to be significantly exacerbated due to the invasion of Ukraine (Table 1), as well as a further 15 countries likely to face fiscal constraints in responding to the crisis (Table 2). Many on this list have been neglected in discussion of the wider impacts of the invasion of Ukraine, though they should be prioritised for international support. The humanitarian and economic response to the food price crisis will need to go beyond the countries which currently draw most attention.
The full data and analysis behind tables 1 and 2 can be found here.
Resources for Ukraine have mostly come at the expense of other humanitarian emergencies
As illustrated by Figure 2, four donors have accounted for the vast majority of humanitarian funding in response to UN humanitarian appeals in recent years. In 2021, the United States, Germany, the United Kingdom and the European Commission represented close to 70 percent of the global response to the annual UN appeal. Drastic reductions in UK humanitarian funding as a result of the government’s aid cuts have so far been partially offset by stronger efforts from the other big three. Overall, funding for the UN’s humanitarian appeals grew from $14 billion in 2017 to $20 billion in 2020, but last year it stagnated even as needs grew–hence the increasing gap between the number of people in need and the number actually helped.
Figure 2. Largest sources of response to humanitarian appeals, 2017-2022

Disclaimer
CGD blog posts reflect the views of the authors, drawing on prior research and experience in their areas of expertise. CGD is a nonpartisan, independent organization and does not take institutional positions.
The views expressed in this post are those of the authors and in no way reflect those of the International Development LSE blog or the London School of Economics and Political Science.
Main Photo: A boy at the Tuban camp for internally displaced people carries water from a water point back to his family’s tent. Credit: EU Civil Protection and Humanitarian Aid on Flickr.


