 Philippe Mongrain estimates that the Conservatives will win around 37% of the popular vote and Labour around 29%. This confirms that, while a Conservative majority government is not out of reach, a minority government appears much more likely.
Forecasting the upcoming general election is both puzzling, not least because, unlike past elections, traditional bread-and-butter issues will not be at the forefront of the campaign. Instead, the focus is the ‘Leave or Remain’ division that has been going on for more than three years.
Although the 2019 election has already been dubbed as unpredictable, I believe a forecasting model that includes some measures of public opinion still deserves a chance. At the beginning of the year, I published a forecasting model for British elections in the Journal of Elections, Public Opinion and Parties. This publication was motivated by the absence of forecasting efforts in academic journals for the 2017 general election and the sentiment that the next election would happen earlier than the previously scheduled date of May 2022.
The model relies on almost 60 years of data (1959–2017) in order to predict the vote shares obtained by the incumbent party, the official opposition, the Liberal Democrats (or the Liberals and the SDP–Liberal alliance before 1992), and all remaining parties. The forecasting equation for the incumbent is based on four variables:
- the percentage of the popular vote received by the incumbent party in the previous election;
- the approval/satisfaction rating of the Prime Minister in the third month preceding the month of the election;
- the GDP growth rate in the second quarter before the election quarter;
- the number of consecutive months spent in office by the incumbent party.
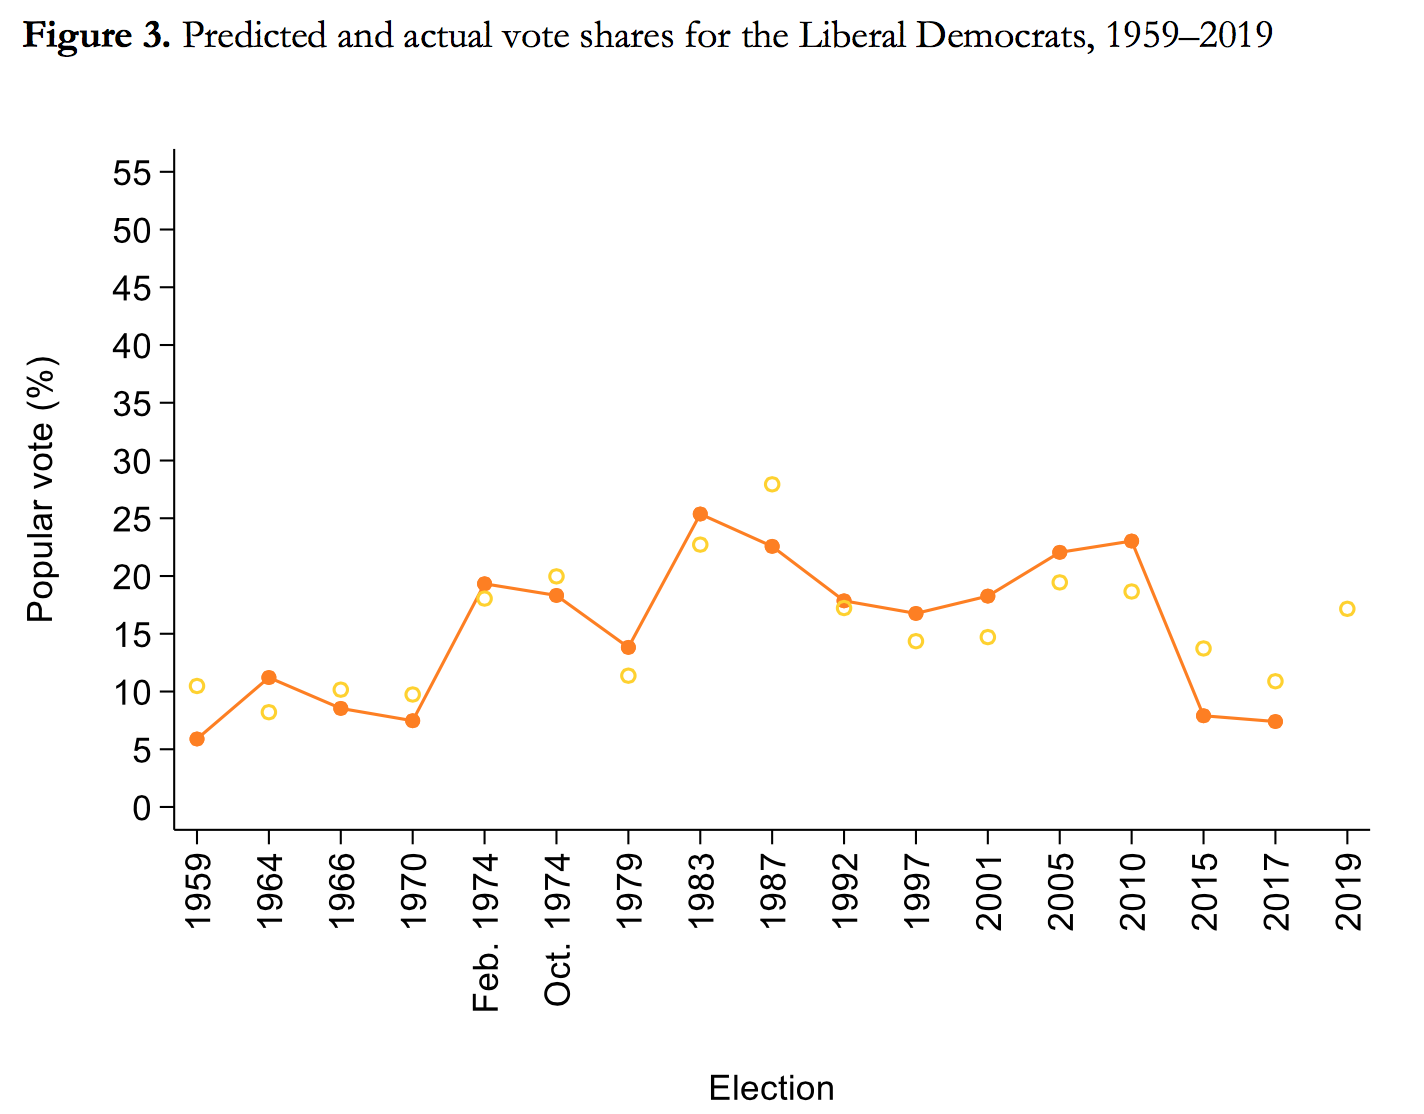
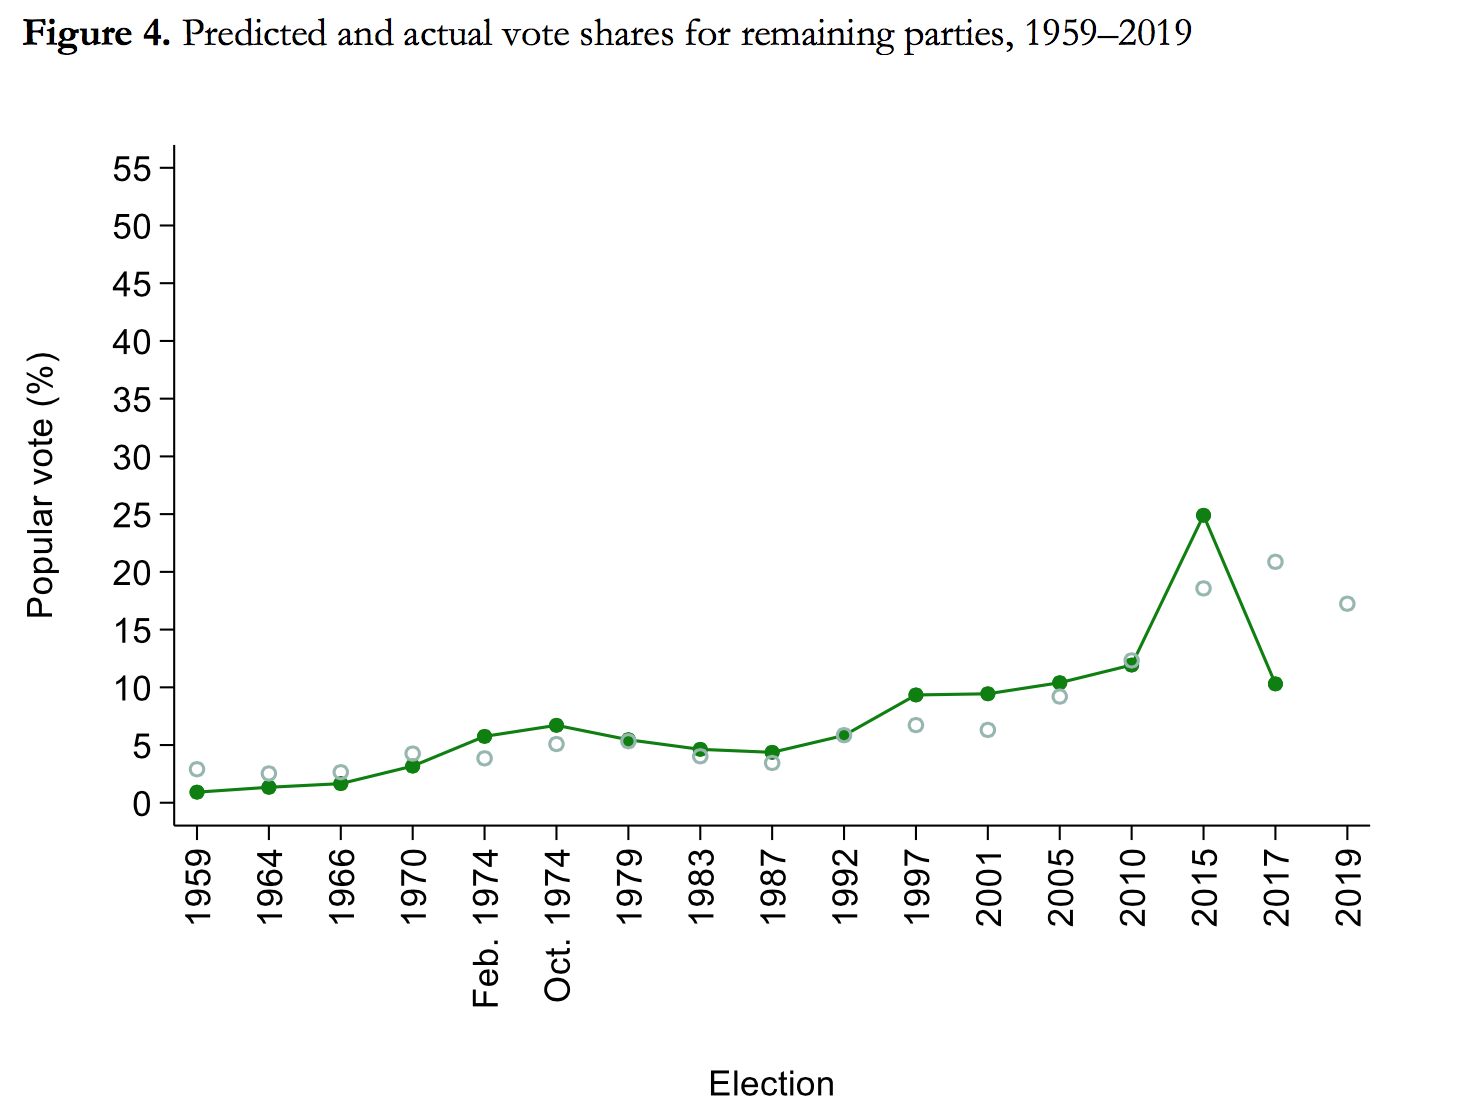
The forecast for the official opposition party relies on the approval rating of its leader and the percentage of vote intentions garnered by the main opposition party in relation to the other opposition parties (what I call the ‘opposition vote monopoly’). The logic here is that the more the largest opposition party is able to monopolise the overall opposition vote, the better it should perform on election day. The equation for the Liberal Democrats is based on the vote intentions they received in the third month before the election month and the vote share they got in the last election. The overall vote share of every remaining party is predicted using vote intention data.
Figures 1 through 4 show the predicted vote shares (hollow circles) and actual results (full circles) for the incumbent party, the Official Opposition, the Liberal Democrats, and remaining parties for all elections held between 1959 and 2017 (as well as the forecasted results for the upcoming 2019 election).
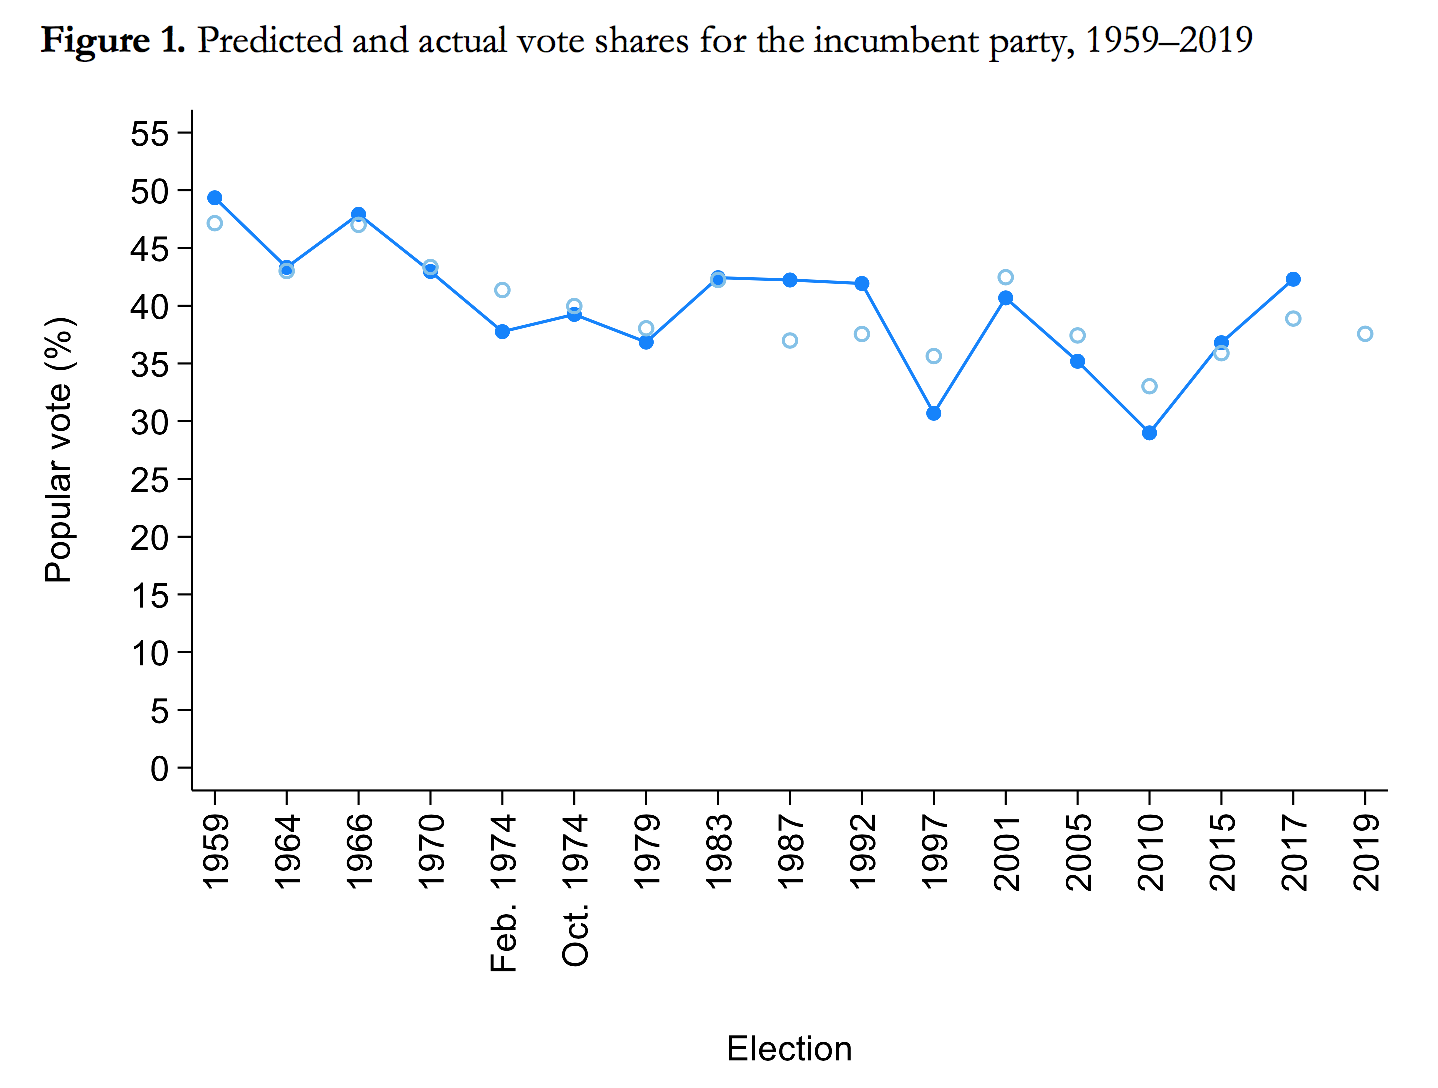
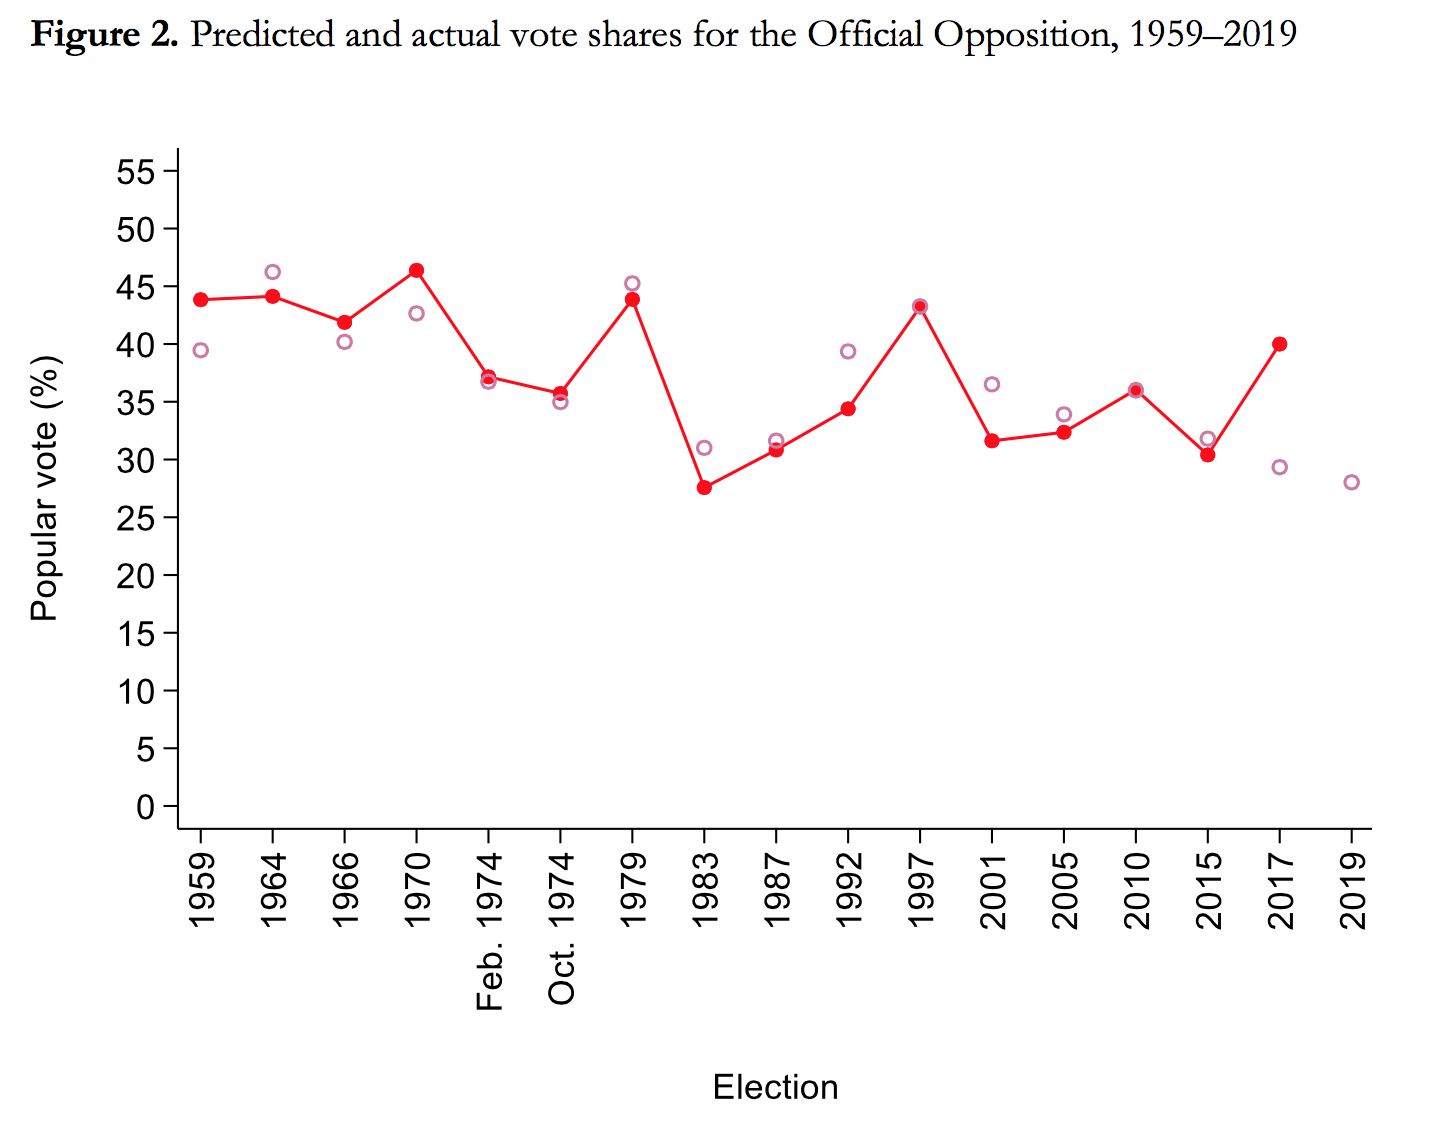
A number of factors are playing against the Conservative Party: they have been in power for almost ten years (which should normally elicit some voter fatigue) and the UK gross domestic product fell 0.2% in the second quarter of 2019. In September, Johnson’s satisfaction rating as Prime Minister stood at 37% according to Ipsos MORI’s Political Monitor. Although it is not particularly high, it is certainly more enviable than Jeremy Corbyn’s satisfaction rating of 16%, which is the lowest score obtained by any opposition leader since the survey began in 1977. The division of the vote could also considerably hurt Labour’s chances to dislodge the incumbent Conservative government from power: Corbyn’s party currently holds less than 40% of all opposition parties (including the DUP) vote intentions – in other words, less than 4 in 10 voters who do not intend to support the Conservatives say they plan to vote Labour. This represents the lowest value of the vote monopoly variable for all 16 elections included in the model.
According to the model, Conservatives should win around 37.2% of the popular vote, while Labour should get around 28.7%. Liberal Democrats are at a distant third with 17% of the vote. Of course, seats are the key to power. Although I will not risk making a seat forecast, winning a majority of seats in the House of Commons with less than 38% of the votes is a rare occurrence: since 1832, this only happened once (in 2005). A Conservative majority government is not out of reach, but the minority government scenario appears much more likely according to the model.
________________
Philippe Mongrain is a PhD student in Political Science at the Université de Montréal and a member of the Canada Research Chair in Electoral Democracy.


Well, so much for theory! Just goes to show that trying to forecast an election is a little more than theory.