
 It is impossible to open the papers today without reading about how the Government’s cuts will cause ‘misery’ or ‘unhapiness’ for particular organizations, socio-economic classes, regions, or communities. Yet how can we actually measure individual well-being across time and space? George MacKerron and Susana Mourato of LSE’s Department of Geography and Environment and the Grantham Research Institute on Climate Change and the Environment have unveiled an iPhone application meant to do just that, which could change the way we think about individual and national wellbeing.
As we face the upcoming era of austerity it will be interesting to see how the national mood changes. In 2005, the BBC measured national happiness against 1957 figures and found that the proportion of people who said they were ‘very happy’ fell dramatically- despite the fact that the country’s GDP had trebled. The thinktank Theos recently found found that 75 per cent of those surveyed about wellbeing believe helping people in the UK is the key to happiness.
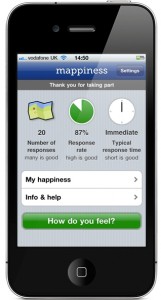 We have developed a new application to track people’s happiness through iPhones, mappiness. The methodology is simple. People with iPhones can get mappiness from the App Store, open it, and sign up. The app then beeps users at random moments one or more times a day. It asks how ‘happy’, how ‘relaxed’ and how ‘awake’ they feel using sliding scales. It also asks for brief contextual information – on activity, companionship and location – which is needed as a control. Users who are outdoors can optionally contribute a photo. While users answer, location is determined using satellite positioning (GPS) and noise levels are measured using the iPhone’s microphone. All data is sent back – wirelessly, anonymously and securely – to a central data store. Early last week we reached over one million responses.
Of course tracking happiness across time is an idea with history: in the 19th century economists imagined a ‘hedonimeter’, a perfect happiness gauge, and psychologists have more recently run small-scale ‘experience sampling’ studies to see how mood varies with activity, time of day, and so on. What’s exciting about our project is the addition of the spatial dimension. By tracking across space as well as time, and by making novel use of a technology that millions of people already carry with them, we hope to find better answers to questions about the impacts of geography, climate, social interaction on happiness.
Tuesday is the new Monday
Our website, keeps real-time hedonimeters that measure happiness across the UK and London against all-time averages. We now have a few simple figures based on a snapshot of our data from the project’s first 6 weeks. We’ve averaged the happiness levels reported by participants on different days of the week and in different areas of the country, and found that Tuesdays brought us the lowest average response, a whole 0.2 per cent lower than Monday.
These figures are illustrated below. Note that the vertical axis is zoomed right in on one part of the 0 – 1 scale.
Mean UK happiness response by day of the week
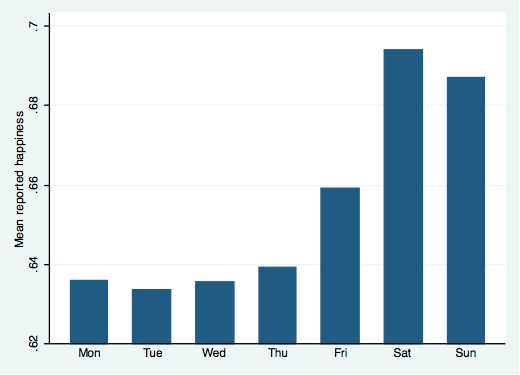
We have about 100,000 data points behind each bar of this graph, and the drop from Monday to Tuesday is highly statistically significant: that is, it’s very unlikely to be the result of a sampling error.
But it is only this: the average happiness reported by some iPhone owners on different days of the week. It isn’t the result of some large multivariate regression, trying to hold everything else constant (though we will, of course, be running such multivariate regressions in future). It isn’t, therefore, some kind of pure effect of Tuesdayness. It probably reflects the fact that Mondays are sometimes Bank Holidays, random variations in the weather, and 101 other factors.
Interactive maps of the UK and London also show us where users have most recently reported feeling happy. Some preliminary analysis shows generally higher levels of happiness in Scotland and Dorset, compared to lower levels in Slough and parts of London. As the number of users grow over time we will be able to provide more detailed analysis of the geographical dimensions of happiness- something that will surely be of value to the eternal questions over the North-South divide in this country.
However, not everyone agrees with the use of happiness measures in public policy. A 2007 report by the Institute for Economic Affairs on Happiness, Economics and Public Policy, argued that measured happiness does not appear to be related to public spending, violent crime, property crime, sexual equality, disability, life expectancy or unemployment- and that bodies like the Whitehall Wellbeing Working Group were a waste of resources.
But we would disagree, as would our colleague Professor Lord Richard Layard, director of the Well-being Programme at LSE’s Centre for Economic Performance. His work on the links between human satisfaction and public policy has been hugely influential over the last few decades. He recently told the Sunday Times that ‘’Mappiness is a revolutionary research idea. It is the best method so far devised for understanding how people’s emotions are affected by the buildings and natural environment in which they move.’
Click here to respond to this article.


I think there`s a fundemental flaw in the approach you academics are taking towards social policy which is neatly exemplified in the headline “how much should WE consider…etc”.
The unspoken assumption is that there is some omniscient “we” sitting on a London equivelant of Mount Olympus grandly dispensing social policy…and having the power to do so.
I`m more inclined to remember SuperMac`s mutterings about “events…dear boy!”and to question “our” capacity to scatter happiness amongst the beleagured and effectively disenfranchised populace…or anything else that isn`t ordained by the omnipresent “markets” of the World.
But that`s perhaps all too much for you disciples of Friedman and Soros to acknowledge when there`s a comfortable living to be made bringing fantasies and sophistries to the masses?