A car’s longevity is important for consumers’ budgets as well as for the environment. However, reliable evidence on the longevity of electric vehicles is hard to come by. Viet Nguyen-Tien and Robert Elliot (along with fellow authors) developed a way to estimate the lifespans of various vehicles on British roads and their implications for consumer choices and environmental impact.
Sleek-looking electric vehicles (EVs) from an increasing range of brands are appearing in car showrooms. But amid the electric buzz, a critical question remains: how long will these cutting-edge vehicles, powered by nascent technologies, last? Buying a car is typically the second biggest purchase consumers make, so longevity is an important consideration.
Researchers and policymakers also need to weigh up a much larger question: what is the long-term environmental impact of the EV revolution? Over the decades, the efficiency of petrol- and diesel-powered cars has improved and their emissions reduced. In a new discussion paper we look at whether EVs, packed with disruptive technologies, can match their level of reliability.
Having an accurate estimate of the longevity of a vehicle is a key factor in assessing its life-cycle environmental impact. For example, the production of an EV can require up to six times more critical minerals and generate 50 per cent more emissions from the production process than its petrol and diesel counterparts. But a durable EV that efficiently uses clean energy sources can quite quickly offset its initial footprint and help in the battle against climate change. Knowing how long an EV will remain roadworthy also helps prepare us for the potential waste stream at the end of its life.
A diverse battlefield
The key challenge is that systematic and objective evidence on EV longevity, especially compared with newer petrol and diesel cars, is frustratingly scarce.
Battery electric vehicles (BEV), which are fully electric, such as Tesla, carry the banner of radical change. But reducing carbon emissions relies on a diverse set of players. For example, hybrids (HEV), championed by Toyota and others, offer a measured advance, boosting efficiency and mitigating emissions while maintaining a high degree of familiarity. As the name suggests, HEVs are powered by both electricity and fuels. The batteries are charged through braking without the need for chargers
Plug-in hybrids (PHEV), such as Mitsubishi’s Outlander, can be charged by a charger and bridge the gap between BEVs and HEVs by offering range flexibility alongside emission reductions. The diverse configurations and differing levels of technological maturity within the EV landscape further emphasises the need to overcome the data scarcity challenge to provide accurate longevity estimates.
The UK as a unique window
The UK’s Ministry of Transport (MOT) tests, which are mandatory, “check that your vehicle meets road safety and environmental standards”. This test offers a unique advantage in the UK, as it provides access to the MOT test history for nearly every car and small van on British roads since 2005. This massive, transparent, and freely available dataset provides a detailed medical record for the entire British vehicle population. Using this unparalleled dataset of over 300 million MOT test results allows us to track not just a vehicle’s existence but also its health and eventual retirement.
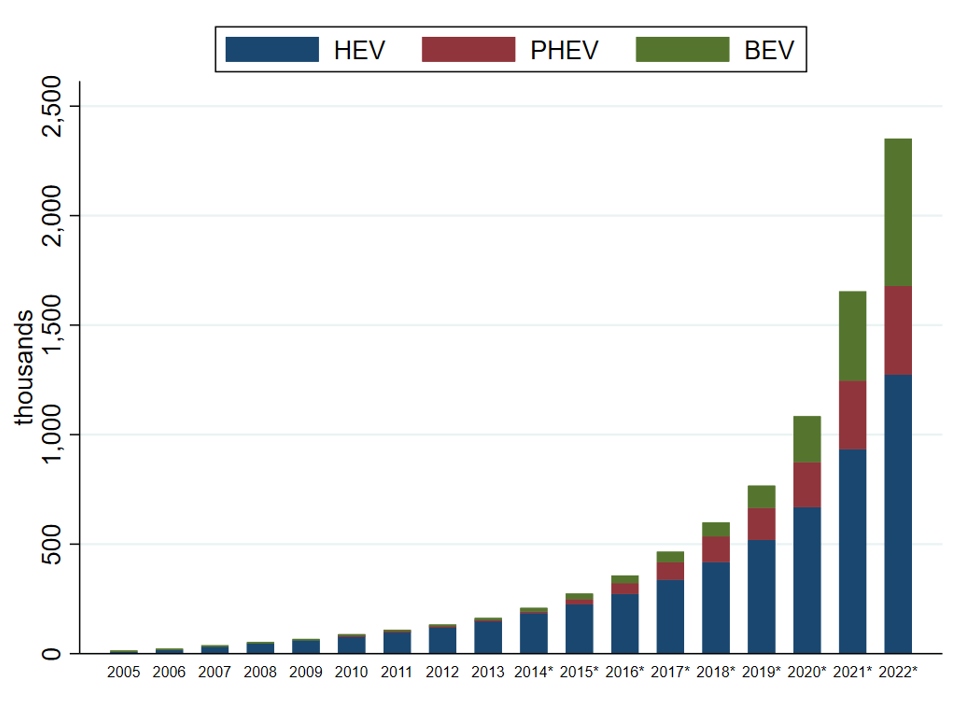
The UK is a good way down the track on EV adoption, and it is possible to get a clear picture of how the future may look in other countries. The UK has the fourth largest plug-in hybrid fleet and the sixth largest battery fleet worldwide, with an impressive 2.35 million electric vehicles (Figure 1), including hybrids, exceeding eight per cent of the entire fleet. The country serves as a real-world laboratory for studying EV longevity. The government’s pledge to end new petrol and diesel vehicle sales by 2035 means the UK is well positioned to become a global pioneer in electric mobility.
Figure 1. Licensed electric vehicles in Great Britain (2005-2013) and United Kingdom (2014-2022): battery electric vehicles (BEV), hybrid electric vehicles (HEV) and plug-in hybrid vehicles (PHEV)

Sources: Nguyen-Tien, Elliott, Strobl, Zhang (2024) calculated using Department for Transport and Driver and Vehicle Licensing Agency data.
Our data-driven solution
In our research, we use the UK MOT data to predict the time each vehicle will remain on the road before retiring, essentially, the vehicle’s lifespan. This approach then informs sophisticated statistical analyses (survival analysis), which is methodologically similar to the way in which medical researchers track patient survival, even when patients stop attending regular checkups.
Table 1 presents the estimated median longevity and lifetime mileage for petrol, diesel, BEV, or (P)HEV cars in the UK and the five most durable makes. The longevity and mileage potential of vehicles varies significantly. While the average car lasts 17.9 years and travels 138,000 miles in its lifetime, petrol and diesel cars show distinct differences. Petrol cars, though slightly longer-lived at 18.7 years on average, fall short in terms of mileage, covering on average only 116,000 miles compared with their diesel counterparts, which clock in at 160,000 miles on average. Hybrids including PHEV emerge as the clear winners, boasting impressive lifespans averaging 25 years and 210,000 miles.
Table 1: Estimated median lifetime and mileage by fuel type
| Fuel type | Median longevity (years) | Median life mileage (thousand miles) | Top 5 durable makes (and life mileage in thousand miles) |
| All vehicles | 17.9 | 138 | |
| Petrol | 18.7 | 116 | Audi (143), Volvo (142), Land Rover (135), Lexus (133), Saab (133) |
| Diesel | 16.8 | 160 | Skoda (182), Volvo (180), Land Rover (176), Volkswagen (176), Honda (175) |
| (P)HEV | 25.0 | 210 | Toyota (245), Honda (190), Hyundai (189), Kia (188), Lexus (183) |
| BEV | 18.4 | 124 | Tesla (204), Nissan (139), Volkswagen (122), Kia (117), BMW (91) |
Sources: Estimates from Nguyen-Tien, Elliott, Strobl, Zhang (2024).
BEVs, while not yet matching the hybrids’ impressive durability, still offer encouraging performance indicators, with an average lifespan of 18.4 years and mileage exceeding traditional petrol cars at 124,000 miles. Brand choice also plays a crucial role. Tesla leads among BEVs, while Toyota is at the top of the (P)HEV category. For petrol and diesel options, Audi and Skoda, respectively, are the best performing in terms of durability.
A vehicle’s lifespan is also influenced by driving patterns and other factors, when controlling for these other variables, Honda emerges as the top petrol performer in terms of longevity. The variation in lifespans across manufacturers may reflect differences in vehicle popularity, demand for luxury, cost sensitivity or even driver characteristics. Details on how different brands performed can be found in our research.
Out of curiosity, we investigated whether vehicle colour impacts longevity. Black paintwork seems to correlate with a shorter lifespan for petrol vehicles, while white appears to benefit diesel and hybrid models. Intriguingly, vivid bright colours like red and blue are associated with more durable BEVs. As previous research suggests, lighter colours may be more visible and thus less subject to passive accidents. Additionally, colour choice may also correlate with unobserved traits that may influence driving patterns.
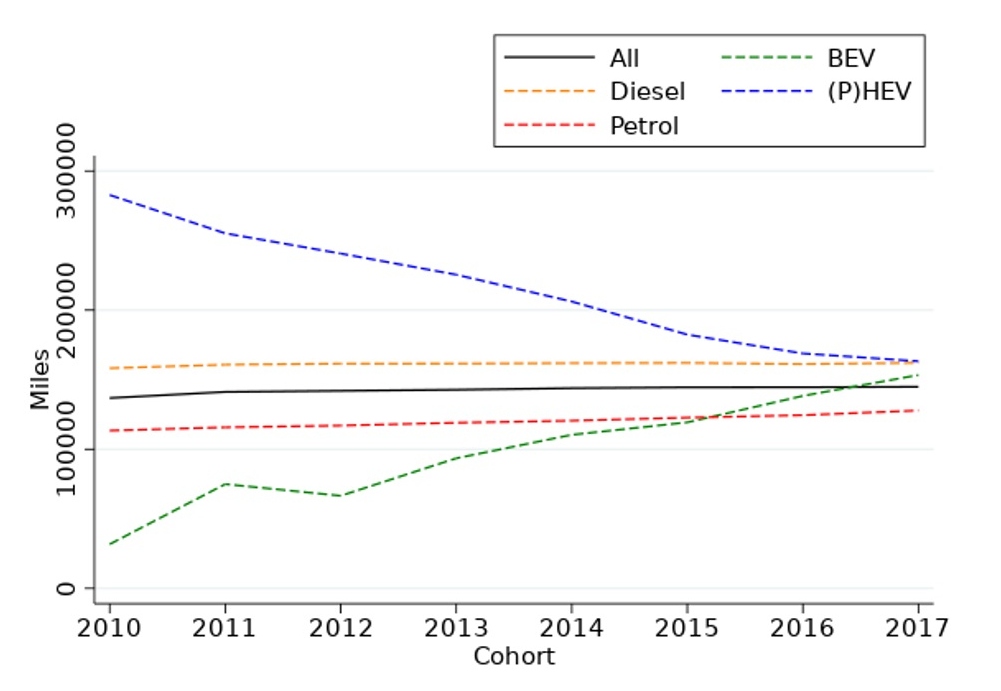
Our analysis also reveals an evolving landscape of expected mileage over a vehicle’s lifespan, driven by changing usage patterns, product variations and technological advances. With the exception of (P)HEVs, Figure 2 shows a general increase in median lifespan. We suspect that the decline for (P)HEVs is linked to the growing popularity of plug-in versions and more inexpensive hybrid models, Despite the decline in longevity, HEVs were still the most reliable option in 2017.
What stands out is the rapid performance improvement of BEVs. By 2017, their average lifetime mileage surpassed the fleet average. The underlying regression model reveals a key factor: BEVs boast a 12 per cent lower “hazard rate” (chance of retirement) than those created in the previous year. This compares with a change of 6.3 per cent and 1.9 per cent for petrol and diesel, respectively. It suggests that while internal combustion engines experience incremental improvements, BEVs are improving at a much steeper rate. BEVs in our sample also show a remarkable increase in usage, with average annual mileage jumping from 2,200 in 2010 to 7,800 in 2017. This is attributed to BEVs appealing to a broader range of buyers and technological advances such as increased range. The average BEV range climbed from 79 miles in 2010 to 151 miles in 2017, making them a more viable option for those who travel farther and reducing range anxiety.
Figure 2: Average (expected) median life mileage

Caveats and future opportunities
While our analysis offers encouraging insights into EV longevity, it is important to recognise the limitations of the study and potential uncertainties. Our focus is on vehicles first used between 2005 and 2017, which means that we are observing a relatively young fleet, with most vehicles still active and recording a 2022 MOT test result.
Changes in policies and unforeseen technological or business challenges emerging later in the lifespan of EVs may disrupt the patterns observed in our model. For example, government interventions, such as large-scale scrappage schemes were largely absent during our study period but could alter patterns of retirement. Similarly, business models like car-hailing and leasing, if not adequately regulated, could lead to premature retirements, as exemplified by the emergence of EV graveyards in China. While extended EV lifespans would be a significant benefit, their realisation may depend on the availability of affordable battery replacements in case the original batteries deteriorate prematurely. Factors such as soaring repair costs, high insurance premiums, challenges with batteries in cold weather, and damaged tyres could influence decisions regarding the scrappage of used EVs.
Despite these uncertainties, the freely available British MOT data and our statistical framework offer a powerful tool for continuous updates. By regularly tracking patterns and adapting our understanding, we can inform policy, infrastructure and individual decisions as technologies and market conditions evolve. For now, it appears that BEVs have caught up and will soon overtake other types of cars in terms of longevity. Coupled with lower maintenance costs the EV revolution appears to be gathering steam (or voltage).
This blog post is based on the CEP Discussion Paper Estimating the longevity of electric vehicles: What do 300 million MOT test results tell us? By Viet Nguyen-Tien, Robert J.R. Elliott, Eric Strobl and Chengyu Zhang
All articles posted on this blog give the views of the author(s), and not the position of LSE British Politics and Policy, nor of the London School of Economics and Political Science.
Image credit Bilanol via Shutterstock


