 Using the Apple Maps Mobility Trends Reports, the Google COVID-19 Community Mobility Reports, and data from a worldwide online survey, Marc Oliver Rieger discusses trends in activity patterns in the UK during the lockdown. Specifically, he finds that there was a significant re-increase of activities before the measures were relaxed – a trend also observed in other countries.
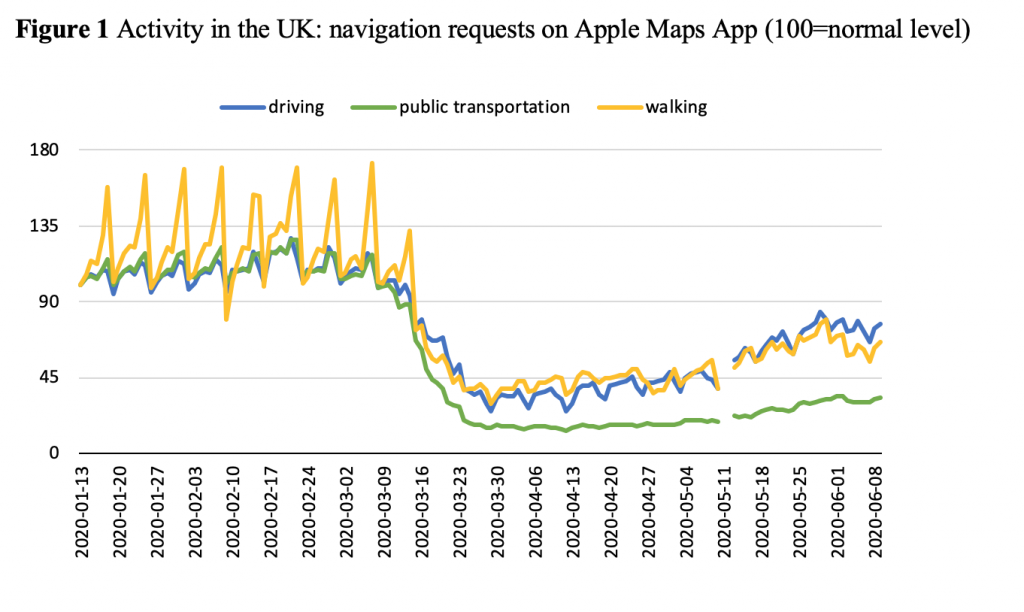
The restrictions that have been imposed to contain the spread of the SARS-CoV2 have led to a dramatic reduction in many activities, including economic and personal ones. In joint work with Mei Wang (WHO-Otto Beisheim School of Management), we look at three measurements for this reduction. First, we look at data provided by Apple: these show how often Apple’s Maps App got navigation requests in the categories “driving”, “walking” or “public transportation”. The values are normalized, so that deviations can be spotted easily. The updated data for the UK is shown in Figure 1.
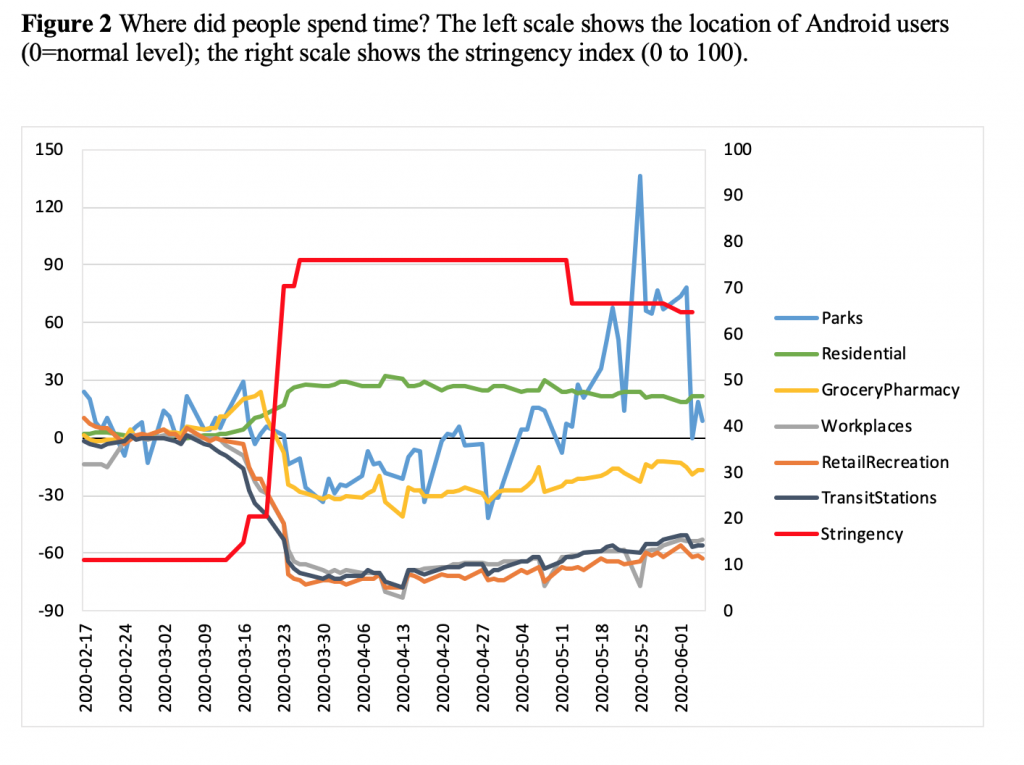
 Second, we use data from Google: these are location data of Android smartphone users. The data show how much time users have been spending in the neighbourhood of certain locations (parks, residential areas, grocery stores or pharmacies, workplaces, retail or recreation areas, transit stations). The most recent UK data is shown in Figure 2. For comparison, we have added the “stringency index”, computed by Petherick et al. which gives a simple numerical value for the amount of restrictions that were in place.
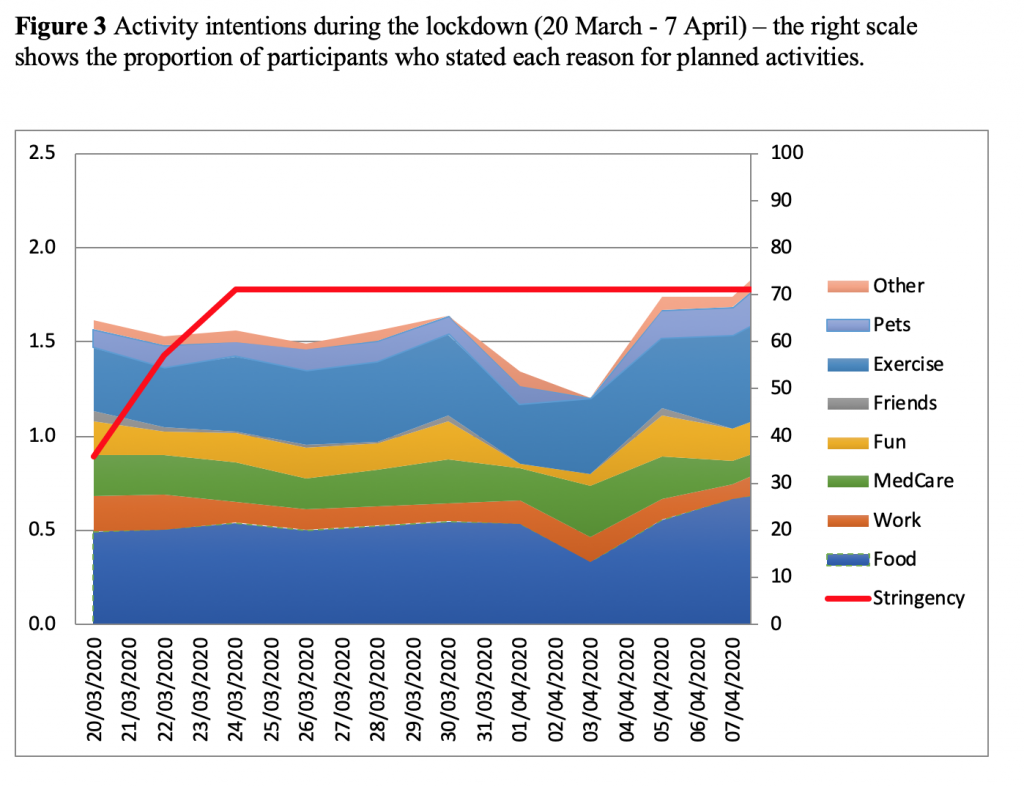
 Third, we use data from an international survey by Fetzer et al. which attracted more than 100,000 responses worldwide. These data allow to dig a bit deeper into the types of activities undertaken. Google data, for example, cannot distinguish between grocery stores and pharmacies (as they are often located too close to each other). People might go to grocery stores out of boredom and not necessity, which is unlikely to be the case for pharmacies. The survey also asked directly the motivational reasons for going out, including categories like “exercising my freedom” that might be considered as less reasonable in the given situation. Figure 3 gives an overview on the patterns for the UK (until 7 April, only, since the survey data ends on that day).
 The three datasets together provide interesting insights: they tell us how the lockdown affected the behaviour of people worldwide and, in particular, in the UK. At first glance, one would assume that a higher level of restrictions directly corresponds to reduced activities. Without changes to the restrictions, however, activities should not change. Our findings clearly demonstrate that this is not the case: people react in a much more flexible way to the regulations. In particular, we find a decrease in activities already before the official “lockdown” but then a slow, steady increase in activities during the lockdown.
We see this clearly in the first two figures: there is a tremendous drop in requests for directions that starts already around 9 March, and which becomes particularly evident in public transportation. This confirms that people did not only reduce their daily activities in general but they were also particularly reluctant to take a bus or train. The decrease continues until the end of March. From then on, a slow increase, first in driving and walking, and then also in the use of public transport can be observed. This is interesting, since the restrictions were still in effect at this point. The pre-crisis levels, however, have still not been reached.
What caused this increase in transportation? Figure 2 gives a few insights on this: the strong increase in park visits can be readily explained with this year’s wonderful spring weather in large parts of the UK and is probably mostly harmless from an epidemiological point of view. A bit more worrisome were other increases, including the number of visits to retail and recreation establishments as well as to groceries and pharmacies. An increase in the need to go to pharmacies seems unlikely with the flu season ending, so it is more likely that people were less reluctant to go grocery shopping. All these increases took place while the full lockdown was still in place. Yet even in recent days and with the easing of the lockdown, we have not reached the original levels of activity.
Figure 3 more or less confirms the overall trend but (for reasons of data availability) only until 7 April. In the graph, we have combined some activities for clarity. A more sophisticated data analysis (using regression analysis) shows that the described trends are, indeed, also statistically significant in all three data sets. In the survey data, a particular interesting result for the UK is that “exercising my freedom” became an increasingly important reason for going out (albeit only for a small fraction of the respondents).
What do we learn from all of this?
The first lesson is that people had already started to react to the pandemic before the government imposed a lockdown: there were significant decreases in activity prior to the lockdown. The latter, however, led to a further unprecedented decrease. It then seemed difficult to fully comply with a complete lockdown for long, as activities began to slowly increase again. Nevertheless, we are still far from a complete return to normality. People still do reduce their activities substantially. These general results are also observable elsewhere: in our paper, we also studied France, Germany and the US and found very similar effects.
We all hope that the lockdown is a unique event that will not have to be repeated. Given the real danger, however, that a second wave of the pandemic can occur, it is useful to understand the response of the population to such measures, and we hope that our study can contribute to this understanding.
___________________
Note: the above draws on the author’s published work in Review of Behavioral Economics.
 Marc Oliver Rieger is Professor of Banking and Finance at the University of Trier.
All articles posted on this blog give the views of the author(s), and not the position of LSE British Politics and Policy, nor of the London School of Economics and Political Science. Featured image credit: by chuttersnap on Unsplash.


