Ethnic minorities fare less well on average in the labour market than their white counterparts. Wouter Zwysen, Valentina Di Stasio, and Anthony Heath connect results from two UK-based field experiments to show the relation between hiring discrimination and labour market penalties, for several ethnic minority groups. Higher hiring discrimination is indeed associated with worse ethnic employment penalties, but similarly discriminated against groups do not necessarily face the same ethnic penalties.
Ethnic minorities in the UK are less likely to find good work than their white British counterparts, even when born and educated in the United Kingdom. While we know that ethnic discrimination in hiring is pervasive and enduring, it is not clear how much of the labour market disadvantage experienced by ethnic minorities can be attributed to employer discrimination. We build on this research and link the discrimination at point of hire directly to the overall lower probability of finding work.
In our work, we find that the groups that face the highest hurdles on the labour market in terms of finding good jobs – such as British of Black African, Pakistani and Bangladeshi descent – are also the groups discriminated against most heavily by employers. This relation is not one on one, however: similar rates of discrimination do not always lead to similar gaps in employment.
Ethnic disadvantage and discrimination have been studied from two main angles. First, researchers send sets of fictitious applications to employers which are identical in terms of education and skill, but differ only in the ethnicity of the applicant – these are field experiments known as correspondence tests. This technique is very well-suited to measure discrimination of employers at this initial step of the hiring process. However, it provides no information on the jobs real people actually apply for, nor about what happens after the invitation to interview where more discrimination can occur. People are aware of the risk of discrimination and can tailor their search to minimise this risk– for instance applying for less-skilled positions, applying with the public sector where discrimination is expected to be lower, or mainly using social networks to find jobs rather than respond to advertisements.
A second strand of literature estimates ethnic penalties –comparing the actual employment outcomes of ethnic minorities to those of the white British majority in the United Kingdom, while statistically controlling for relevant differences such as age, qualifications, locality. Because ethnic penalties are calculated from real-world survey data, group differences in labour market outcomes may reflect differences in characteristics that are not known to researchers but important for finding a job, such as motivation, perseverance or job search efforts. It is impossible, with survey data, to isolate discrimination as the reason for these differences.
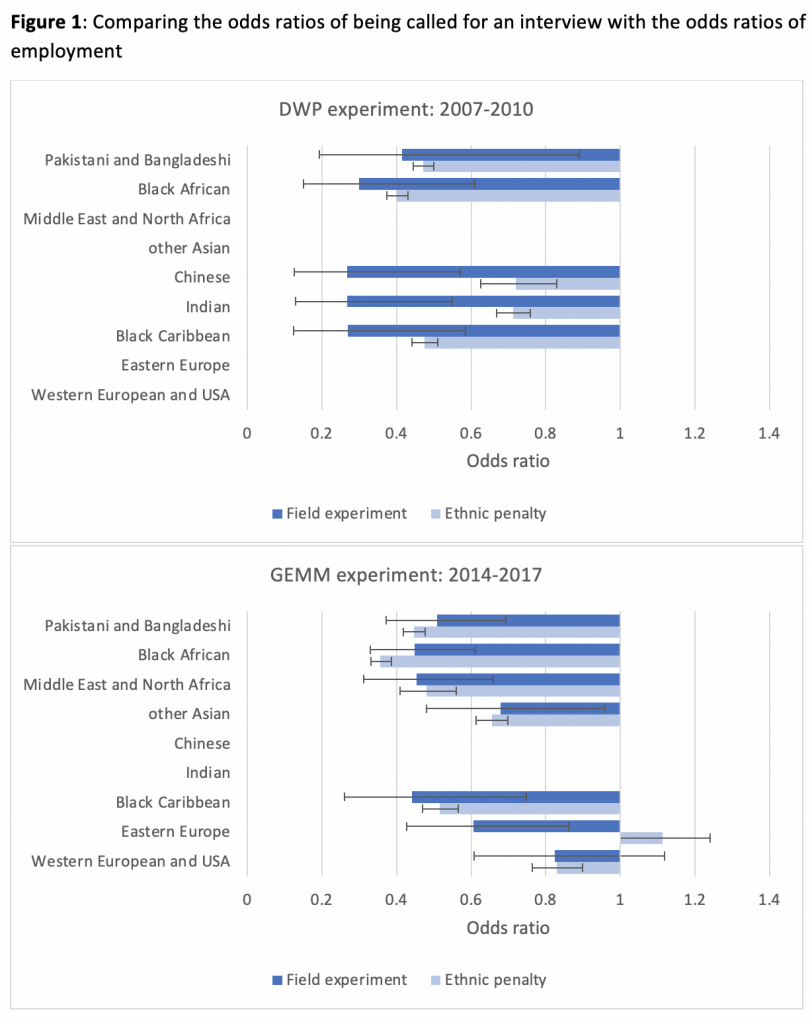
We use two large field experiments carried out in the UK, the first funded by the Department of Work and Pensions in 2008/2009 and the second as part of a larger European project conducted in 2016/2017. From these experiments we estimate the odds ratios of receiving a positive response by employers (such as the request to provide additional information or the invitation to a job interview) for a minority applicant compared to a white British applicant – this means we express the odds of a minority applicant being called back as a proportion of the odds for an otherwise similar white British applicant. The smaller this proportion, the greater the inequality. As an example, for a black African applicant in the GEMM experiment the odds of being called back after applying are less than half of those for an otherwise identical white British applicant. We then used the UK Labour Force Survey to estimate similar odds ratios, but now for the probability of being employed rather than unemployed. We restricted the analysis to the same ethnic groups and to respondents with comparable socio-demographic characteristics to the applicants in the field experiments. Figure 1 shows these odds ratios.
Note: the figure compares estimated odds ratio of receiving a positive call-back (field experiment) with the estimated ethnic penalty from the UKLFS 2007-2010 and 2014-2017 from a logistic regression controlling for gender, age (squared), time since leaving education, highest qualifications, being a UK citizen, cohabiting, having a dependent child in the household, year of survey and region of residence, weighted to represent the population (N=447,559 and 541,907 resp.). The 95% confidence interval is shown for both. The label “Asian” refers to other Asian ethnicities, not including Pakistani/Bangladeshi.
First, we find similarly high levels of discrimination for Pakistani and Bangladeshi, black African and black Caribbean groups. Compared to the DWP experiment, the GEMM experiment included European and US migrants and a larger group of Asian minorities, and it is clear that discrimination for these groups was somewhat lower. Second, we observe more variation in ethnic penalties than in discrimination rates: employment gaps are clearly worst for Pakistani and Bangladeshi, Black African, and black Caribbean British and best for the Chinese, East European and Indian groups.
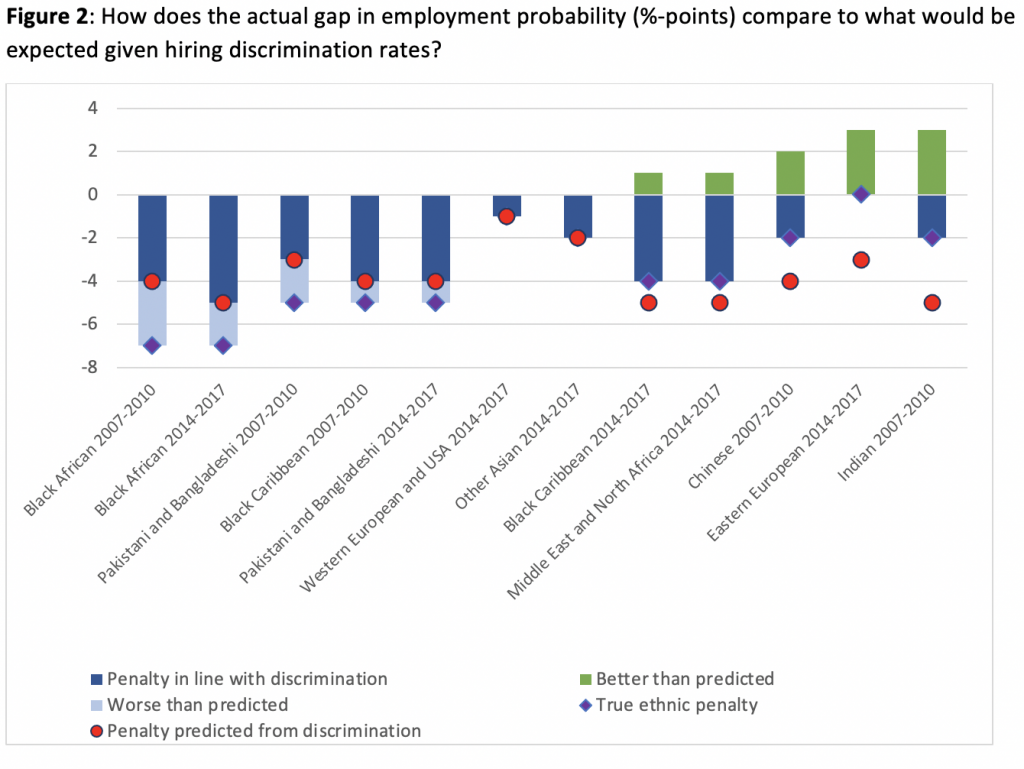
Note: The figure shows the total ethnic penalty – the gap in employment probability in percentage points – estimated through logistic regression from the LFS, contrasted with the gap predicted purely on hiring discrimination rates. The true ethnic penalty is divided into the part that is expected given the group-level discrimination rates, the excess penalty (worse than predicted) or the part that is better than predicted. Regressions control for age (squared), potential experience; highest qualification; whether they are a UK citizen; government office region; whether they cohabit; whether a dependent child is present; year of the survey and gender. The figures for 2007-2010 used the Wood experimental discrimination and the appropriate sample from the Labour Force Survey; the 2014-2017 figures used the GEMM experimental discrimination and the appropriate sample from the UK Labour Force Survey. The label “Asian” refers to other Asian ethnicities, not including Pakistani/Bangladeshi. The ethnic penalty for Eastern Europeans in 2014-2017 is 0.
Figure 2 compares the gaps directly, by contrasting the difference in the probability of employment that we would expect purely based on the discrimination rates recorded in field experiments, with the actual gap observed in surveys. The main finding is that discrimination has clear real-world repercussions on the employment probability of ethnic minorities. Black Caribbean minorities for instance are about 5%-points less likely to be employed and this is in line with the high discrimination they experience. Some groups, however, have relatively good employment outcomes despite high levels of employer discrimination (Chinese and Indian minorities, and Eastern European minorities).
In our paper we discuss possible reasons for these patterns, such as group differences in resources and socio-economic background – for example, people may benefit from an economically stronger or more highly educated family and co-ethnic network. They may also reflect differences in how people look for jobs as a result of perceived or anticipated discrimination. One way to avoid discriminatory employers is through self-employment or public sector jobs. Another way is to cast a wider net and apply to as many jobs as possible in a variety of sectors, or to look for jobs through social networks.
Based on the findings in the UK, it seems likely to us that ethnic minorities – in light of the discrimination they face – rely more heavily on their social networks (friends, family, and co-ethnics) to find jobs than the white British do. Through this informal channel, socio-economic differences between ethnic groups then affect their relative ‘success’ in finding work despite strong levels of employer discrimination. We call for research that acknowledges the strategies of ethnic minority job-seekers and their efforts to avoid discriminatory employers.
_____________________
Note: the above draws on the authors’ article published in Sociology.
Wouter Zwysen is Senior Researcher at the European Trade Union Institute.
Valentina Di Stasio is Assistant Professor in the Department of Interdisciplinary Social Science and the European Research Centre on Migration and Ethnic Relations at Utrecht University.
Anthony Heath is Emeritus Fellow and Director of the Centre for Social Investigation at Nuffield College, University of Oxford.


It’s a good read. Can resonate with this personally as I am looking for a job for almost 2 years despite my skills and qualifications i am still unemployed. I came to UK accompanying my husband from India on a dependent Visa. Despite being into IT industry and a ton of experience into Recruitment’s I haven’t received any positive response. This impacts my mental well being and makes me believe firmly into discrimination against me.
Firstly, a good read.
I’ve been reading on discrimination in the UK job market for far to long; question remains, what’s actually being done about it. From my perspective, nothing at all.
Great Work. I am wondering how the ethnicity of the applicant was apparent to the employer? Is that based on the application form where the applicant is supposed to tell ethnicity or just based on the name?