While the Northern Ireland Assembly is still not working, that is not true of local government in the region. But what do the results of the 2023 local elections tell us about the broader shifts taking place in the region’s political landscape? Brendan O’Leary and Jamie Pow argue that the elections showed changes that could be described as “historic” and provide key clues about where politics in Northern Ireland might go from here.
Northern Irish local governments have few powers, so elections to them are widely seen as exercises in displaying the strength of the region’s political parties and blocs. The electoral system used is the single transferable vote (STV) system of proportional representation using the 11 districts shown in the map below, and with multiple councillors elected from each area. The turnout was 54 per cent, up slightly on last time in May 2019.
There are now four safe nationalist councils (Derry, Newry, Fermanagh and Mid-Ulster), in contrast with two safe unionist councils – in which unionists with a capital U have a combined majority (Mid & East Antrim, and North Down). Five councils lack either a nationalist or a unionist, with a capital U, majority. In Belfast, nationalists are the leading bloc, very close to obtaining a majority, and look likely to obtain such a majority five years from now. In Armagh, Banbridge and Craigavon, unionists hold that position, but seem likely to slip a little in future. In three councils, unionists with a capital U comprise fifty percent of the councillors (Causeway Coast & Glens, Antrim & Newtownabbey, and Lisburn & Castlereagh).
Map: The 11 Local Government Districts – and the difference between first preference votes for the nationalist bloc and the unionist bloc in each
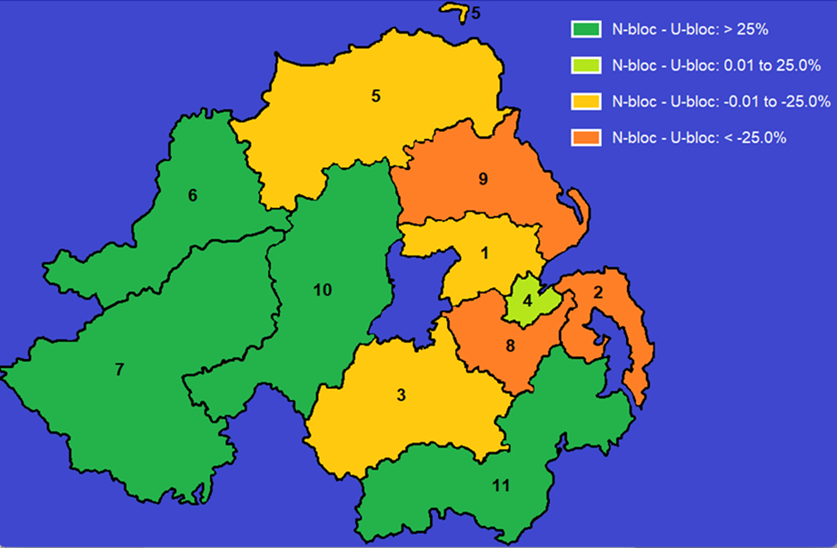
Notes: The names of the districts are: Antrim & Newtownabbey (1), Ards & North Down (2), Armagh, Banbridge & Craigavon (3), Belfast (4), Causeway Coast & Glens (5), Derry and Strabane (6), Newry, Fermanagh & Omagh (7), Lisburn & Castlereagh (8), Mid & East Antrim (9), Mid-Ulster (10), Mourne and Down (11)
The map also indicates the most salient electoral outcomes, namely the extent to which the votes for the nationalist bloc exceeded those for the unionist bloc or vice versa. The “nationalist parties” and nationalist and republican independents jointly won 44 per cent of the votes. The parties in this bloc are Sinn Féin (SF), the Social Democratic and Labour Party (SDLP), Aontú, People before Profit (PBP), and the Irish Republican Socialist Party (IRSP). The “unionist parties” and unionist and loyalist independents won 40 per cent of the votes. The parties in this bloc are the Democratic Unionist Party (DUP), the Ulster Unionist Party (UUP), Traditional Unionist Voice (TUV), the Progressive Unionist Party (PUP), and the Northern Ireland Conservatives.
In the four dark green areas the nationalist bloc was well ahead, as the key to the map shows, and in the single light green area (Belfast) it obtained 49.6 per cent of the vote. The unionists were well ahead in three deep orange areas near Belfast, and less so in the two light orange districts. In addition, there are an important set of “other parties” that are neither officially unionist nor nationalist, including the Alliance, the Greens, Labour Alternative, the Workers’ Party, and the Socialist Party. They won just under a sixth of the votes. Comparing the voting patterns here with those in the last Assembly election in May 2022, it is noteworthy that the 2023 first preference vote (FPV) totals for the main nationalist parties represent just over 90 per cent of the number of votes they received in May 2022, whereas unionist parties had a significantly lower percentage, 82 per cent, perhaps suggesting a mobilisation and enthusiasm gap between the two blocs.
Parties’ individual performance
Within the nationalist bloc Sinn Féin emphatically won most votes and seats across the region – both in first-preference votes (31 per cent, with a large a gain of 7.8 points on 2019), and in overall council seats won (144, a gain of 39, 31.2 per cent). Most Sinn Féin gains came at the expense of the SDLP. On the unionist side, the DUP came second in the region in first-preference votes (23.2 per cent, slightly down), but retained the same number of councillors.
The soft nationalists of the SDLP (39 seats, down -20) and the soft unionists of the UUP (54 seats, down -21) suffered almost identical losses in numbers of seats, though the percentage share lost by the SDLP was higher (-34 per cent) compared to the UPP (-28 per cent).
The Alliance Party came third in first-preference votes (13.3 per cent), falling just shy of 100,000 votes, and winning 67 council seats, one in seven. Its small seat bonus of 14 on its 2019 performance came through lower-order STV transfers from voters for other parties. Analysis of electoral data over time by Dr Philip McGuinness suggests that “Alliance’s best days may be behind them.” That remains to be seen. But going forward, rather than seeking equidistance, Alliance may have to lean further toward the nationalist bloc than the unionist bloc since Sydney Elliott has noted that:
“Alliance terminal transfers [in the three STV-PR elections held between 2017 and 2022] have gone increasingly to SDLP, SF and other republican parties. The difference in preference over unionist parties rose from 5.1 per cent in 2017 to 18.2 per cent in 2019 and 48.3 per cent in 2022. At face value, this indicates that modern Alliance voters are more inclined towards SDLP, SF and other nationalist and republican parties.”
Past the tipping point
Northern Ireland was invented in the UK’s Government of Ireland Act of 1920 to ensure a two-to-one Protestant and unionist majority. A century after its formation, the founding rationale of Northern Ireland has faded into the twilight. The 2023 local government elections display neither a Protestant demographic majority nor a unionist electoral majority. The most important underlying factors that explain the tipping or inflection point marked by these elections are demographic changes.
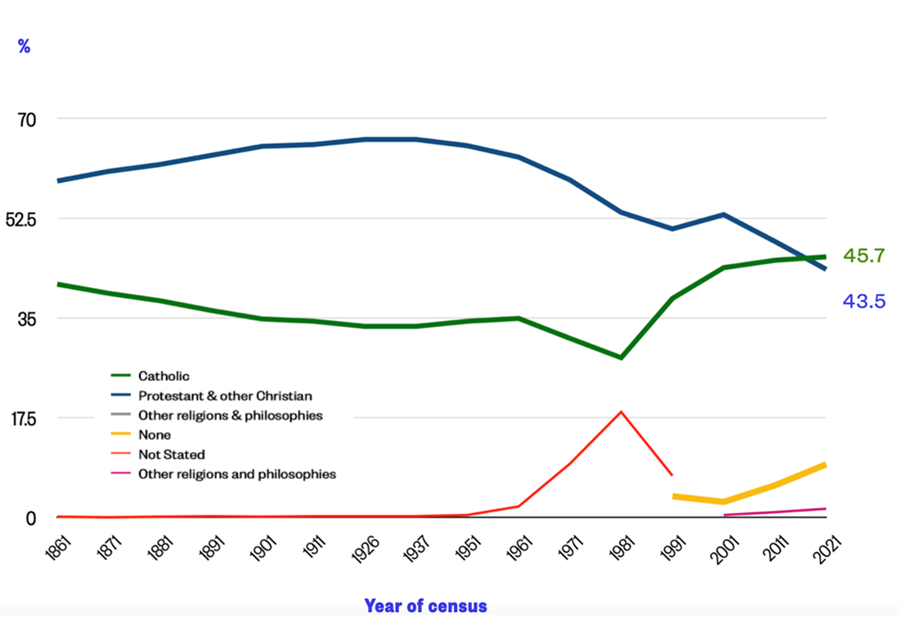
According to the Northern Ireland census of 2021, partly published in 2022, cultural Catholics – those who identify as Catholics or who were brought up in Catholic households – outnumbered cultural Protestants for the first time since a census was counted in the six counties that became Northern Ireland, as shown in Chart 1 below.
Chart 1 . Northern Ireland’s religious demography: Proportions, 1861-2021
See original also for Notes.
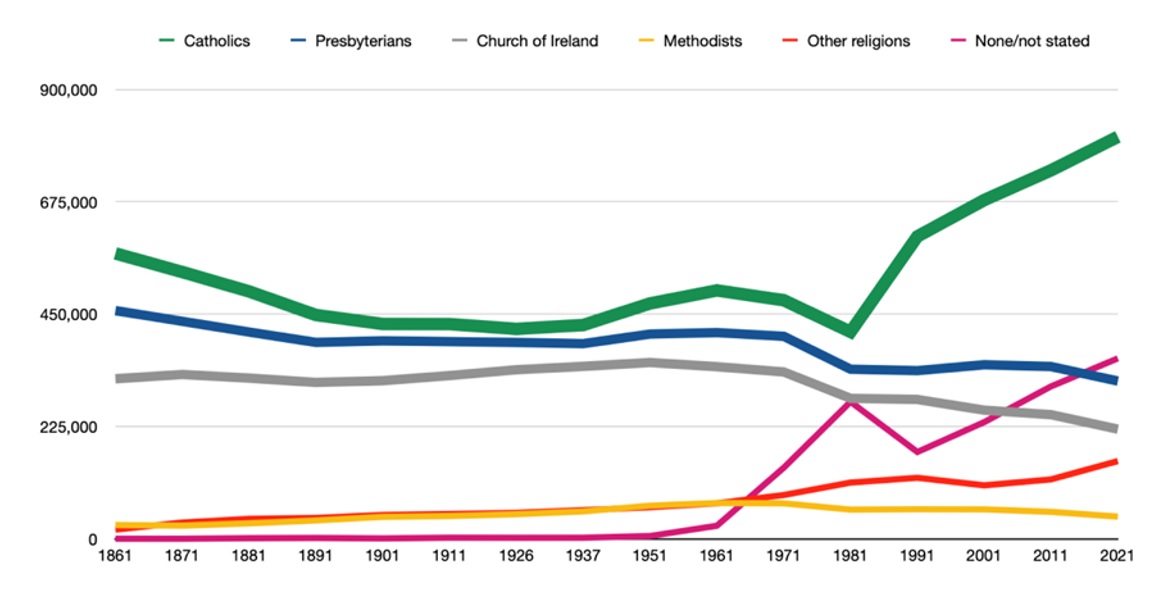
No one denies the strongly established link between demography and electoral behaviour in Northern Ireland: most unionists have been cultural Protestants, and most nationalists have been cultural Catholics. The scope of the effects is disputed, as is the degree to which they are changing. For now, recent ARINS-Irish Times survey data confirm that the proportion of Catholics who favour the maintenance of the Union is higher than the proportion of Protestants who favour Irish reunification. The absolute numbers of those identifying explicitly with a religion in 2021 are also shown in Chart 2 below. Among religious adherents, a Catholic demographic majority has arrived.
Chart 2. Northern Ireland’s religious demography: Absolute numbers of adherents 1861-2021
Other non-census indicators, not reported here, suggest that all major Christian denominations are experiencing fast-paced secularisation. Less clear is whether a cultural Catholic electoral majority will exist before the next census in 2031. To predict that accurately we would need to know the exact breakdown of cultural Catholics among the “Nones.” What can be said with strong confidence, barring major off-trend migratory movements or a major shift in differential outbound migration at the expense of cultural Catholics, is that by 2030 the electoral fate of Northern Ireland’s future will no longer be in Protestant hands.
This is an abbreviated version of the analysis “The Turning Point? The Northern Ireland Local Government Elections of 18 May 2023” published on the Royal Irish Academy blog.
All articles posted on this blog give the views of the author(s), and not the position of LSE British Politics and Policy, nor of the London School of Economics and Political Science.
Image credit: Remizov / Shutterstock