

 By analysing 121 opinion polls, Harold D. Clarke, Matthew Goodwin, and Paul Whiteley outline what happened with the EU referendum survey results. They explain why internet surveys performed substantially better than telephone ones – contrary to the post-2015 General Election ‘wisdom’ that telephone surveys should be preferred. Underlying trends showed that once methodological artefacts are controlled, Leave was almost certainly ahead of Remain over the entire last month of the campaign – and possibly throughout 2016.
After the 2015 general election, pollsters were roundly criticised for their failure to predict the Conservative victory. Did they fail again in the EU referendum? If so, just how badly did they do? Did they all get it very wrong, or did some do much better than others? And, taking artefacts introduced by polling methodology into account, what did underlying trends in Remain and Leave support look like in the run-up to voting day? Going forward, what lessons can we learn?
We address these questions by using a technique called ‘dynamic factor analyses’ on 121 internet and telephone surveys conducted between January 11 and June 22, 2016.[i] We use a statistical model originally developed in research on the performance of polls conducted in an Australian national election campaign.[ii] A large majority of the survey data employed here was gathered by nine survey organisations (‘houses’) and we also include several additional surveys in a residual ‘miscellaneous’ category for other organisations reporting one to three polls.
Modes
We begin by investigating what survey researchers call ‘mode’ effects. These effects concern the impact of differences in the way surveys are conducted on the results they produce. In the case of the 121 EU referendum surveys of interest here, all were administered either by internet (N = 81) or telephone (N = 40). Analysing the results (percentages of Remain and Leave supporters in various surveys) using our model reveals that both types of polls significantly overestimated the Remain vote share and underestimated the Leave share (see Figure 1). However, there were sizable differences between the two types of polls, with the mode effect for equaling 5.1 per cent for internet polls as compared to fully 9.2 per cent for telephone polls.[iii] Taken as a group, internet polls tended to perform considerably better than their telephone-based rivals.
 Houses
What about the performance of individual survey companies? Our analysis of house effects indicates that survey firms varied markedly in their ability to gauge EU vote intentions. Figure 2 documents that, for the 9 survey organisations considered, TNS-BMRB, ICM and YouGov performed best — their overestimates of the Remain vote share were +2.24 per cent, +2.71 per cent and +3.24 per cent, respectively. Similarly, these three houses did best on estimating Leave support. TNS-BMRB underestimated the Leave share by -2.35 per cent, with ICM missing by -2.81 per cent and YouGov, by -3.34 per cent. All of the surveys conducted by TNS-BMRB (5 surveys) and YouGov (28 surveys) were done by internet, as were 23 of 26 ICM surveys.
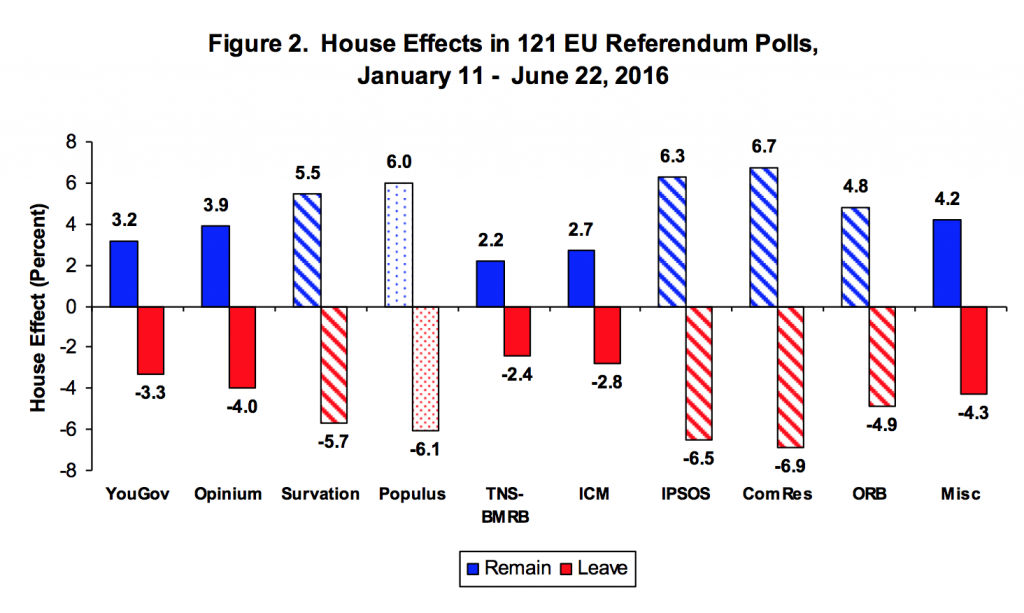 Note: solid colored bars are for survey houses doing all or most of their polling by internet; striped bars are for survey houses doing all or most of their polling by telephone. Populus has 3 internet polls and 2 telephone polls.

The three firms performing worst were Populus, IPSOS and ComRes, with Remain house effects equaling +6.02, +.6.34 and +6.72 per cent, respectively. Populus missed the Leave percentage by -6.10 points, whereas IPSOS missed by -6.45 per cent and ComRes by -6.85 per cent. All 7 of IPSOS polls were done by telephone, as were 9 of the 11 ComRes polls, and 2 of the 5 Populus polls. Survation was another house that performed poorly (a +5.54 per cent overestimate for Remain and -5.67 per cent underestimate for Leave). All but one of Survation’s 8 polls were conducted by telephone. ORB, with a Remain house effect of +4.76 per cent and a Leave house effect of -4.87 per cent, did 9 of its 13 polls by telephone.
Underlying Trends
By controlling for mode and house effects, our analyses enable us to estimate underlying trends in the dynamics of support in EU referendum vote intentions. The results (Figure 3) indicate that Leave led Remain over the entire period from 11 January 2016 onward. The size of the Leave lead varies widely—from a low of .39 per cent (4 February) to a high of 13.2 per cent (12 June)—but Leave is always ahead.
The analysis also provides insight regarding the effects of various events that occurred during the campaign. For example, contrary to his intentions, US President Barack Obama’s widely publicized ‘UK to the back of the queue’ intervention may have boosted, rather than diminished, Leave support. In contrast, as numerous observers have speculated, the murder of Labour MP Jo Cox on 16 June may have precipitated an ongoing erosion in Leave support over the final week before the vote. That downturn in Leave’s vote intention share notwithstanding, the analysis documents that over the last month of the campaign the lower bound of the 95 per cent credible (confidence) interval for the Leave vote always exceeds the 50 per cent mark. This means that Leave was very likely ahead throughout this entire period.

What lessons can we learn?
Overall, the analyses suggest two general lessons for consumers of political polls. First, house effects associated with selected internet survey firms were quite modest, whereas firms relying heavily or exclusively on telephone surveys found themselves considerably further off the mark. After the 2015 general election, internet surveys were widely criticized and some commentators claimed that telephone surveys were a preferred alternative. At the time this assertion seemed dubious given that telephone surveys’ typically dismal response rates clearly gainsays any claim to be true ‘probability’ surveys. As documented above, the relatively poor performance of telephone surveys in the EU referendum reinforces doubts about their superiority.
A second lesson is that the ‘topline’ results from surveys are not enough. If observers had used the polling data as inputs to statistical models of the underlying dynamics of EU referendum vote intentions rather than risking being misled by the vagaries introduced by mode and house effects in successive individual polls, they might not have been surprised by the Brexit result. High quality polls by reputable survey houses should be viewed as a key resource—not a substitute—for informed political analysis.
___
Harold D. Clarke is Ashbel Smith Professor, School of Economic, Political and Policy Sciences, University of Texas at Dallas, and Adjunct Professor, Department of Government, University of Essex.
Matthew Goodwin is Professor of Politics and International Relations at the School of Politics and International Relations, University of Kent.
Paul Whiteley is Professor at the Department of Government, University of Essex.
References
[i] The polling data for the UK EU referendum are available here. “Undecideds” are allocated proportionately to the Remain and Leave categories
[ii] See Simon Jackman, ‘Pooling the Polls Over an Election Campaign‘. Australian Journal of Political Science 40: 499-517. The analysis employs Bayesian MCMC methods. Posterior distributions for model parameters are generated using Winbugs 14 in conjunction with the R2Winbugs R package.
The pooling the polls model has two equations—a measurement equation and a state equation for the latent level of Remain/Leave support. The measurement equation is:
yit = δi + αt + εit
where: yit = is a poll by survey house i at time t; δi = house or mode effect parameter; αt = latent vote intention (Remain or Leave) at time t and εit is a stochastic error ~N(0,σ12).
The state (latent transition) equation is a random walk: αt = 1.0* αt-1 + ζt where
ζt ~ N(0, σ22). εit and ζt are assumed to be independent.
[iii] Statistics reported in Figures 1, 2 and 3 are means of posterior distributions of parameters of interest.


What am I missing?
The Research (above) suggests that
a) internet polling was better than telephone
b) some Houses were more accurate.
We could all have reached that conclusion 😉
Where is the explanation that at least 5% of those responding Remain were lying?
(i.e. evidence not speculation)
Or less harshly, where is the “evidence” that stay-at-homes amongst Remain responders exceeded Leave responders by 5% or more?
“The (Referendum) is actually skewed by how many people want to and are able to make it to their polling station on the day” (weather etc)
This may be true – but how does that explain the analysis (above) that says Leave ALWAYS had a majority?
All I hear in the media about opinion polls is how they got it wrong. Has anyone actually stopped to think that they might actually be more representative of public opinion than the referendum result? The latter is actually skewed by how many people want to and are able to make it to their polling station on the day. In fact this analysis is largely wrong because it doesn’t take this into account. Weather can be a factor in this (with storms over many city area that voted remain on the referendum day), as well as the timing, with many students, (who are more likely to vote remain) away from home. Then there’s postal votes, a large number of which never made it to Britain from abroad. Had we been given the option to vote online, (or even on another day), then the result could have been different, and the graph showing that leave “was always in the lead” would be reversed because it is based entirely on the assumption that the polls are wrong and the referendum result is somehow a perfect expression of public opinion, which it was not. How long is it going to be before we embrace technology and allow people the choice to vote online as well as at polling stations?
Even if opinion polls could somehow overcome the absurdly small sample sizes without introducing errors because of the subjective decisions involved in making a non-random “representative” sample, one bias would remain: all polls are inevitably skewed towards the kind of people who are able and prepared to answer opinion polls. The probability of these being representative of the entire voting population is vanishingly small.
An interesting analysis, but I find the second conclusion a little disingenuous:
“A second lesson is that the ‘topline’ results from surveys are not enough. If observers had used the polling data as inputs to statistical models of the underlying dynamics of EU referendum vote intentions rather than risking being misled by the vagaries introduced by mode and house effects in successive individual polls, they might not have been surprised by the Brexit result.”
How can the pollsters estimate the house and mode effects until the final result is known? Most people are interested in the absolute end result, not in the relative change over time (which can also be seen even with house and mode effects present). I don’t understand how applying a statistical model would have altered the ability to predict the final outcome ahead of time. Indeed, what are the priors in the Bayesian MCMC method that you use? How different is the trend analysis performed this way from one in which you simply subtract the house and mode effects? It seems to me that this is 20:20 hindsight, but doesn’t offer a method to predict the result ahead of time.
Very interesting account of the failure of indicating the real trends in opinions. One just wonders why this powerful analysis was not performed two weeks before the referendum on the as yet inconplete series. It might have informed the events, rather than become wisdom after the event?
Whenever I’m asked by a pollster what my intentions are, I always state the opposite – my revenge for a time-wasting call.
An interesting and unusually balanced (read “proper academic”) analysis which raises some worrying points.
First, it is clear that whatever methods are being used, samples are being seriously polluted by external factors. A couple of commentators have remarked that the “Out” option was deemed socially unacceptable by many parts of the media, within the public sector and academia and parts of business, and that expressing an opinion in this direction was likely to result in considerable abuse on social media or personally.
The destructive power of the “Twitterstorm” is known to pretty much the entire population, and most people will wisely avoid giving any opinion which may result in global bullying and insult simply because a particular view mildly in one direction is expressed.
It is therefore likely that whatever question was asked and whatever medium was being used, there would be a considerable number of respondents who would not answer truthfully.
Second, if this above remarks reflect accurately, a new and worrying polarisation is taking place which will make the entire business of opinion assessment unreliable and hence unusable, which is not a good development. The current relative – or at least perceived – anonymity of the Internet polling methods cannot in any sense be relied upon in the medium term.
Without wishing to teach my granny how to suck egg, perhaps if the pollsters had put their calculators to one side trying to create or identify trends using small data sets gathered from across the country, , they may have been better served by also carrying out large scale surveys in individual towns as well , and compare the two.
The polls certainly seemed to identify which towns would vote Leave or Remain more of less spot on, but the disconnect between the published polls and the reality on the ground across so much of the country was so far out of kilter it was embarassing.
https://www.theguardian.com/commentisfree/video/2016/jun/14/labour-supporters-brexit-stoke-on-trent-eu-referendum-video
I have no doubt the polls will come up with some mitigating reasoning why they were wrong, but I doubt it will prevent it happening again. There would appear to be something fundamentally wrong in the methodology for this type of electoral event. Perhaps the various methodologies of phone and online polls need binning, and with a clean sheet go back to standing in actual town centres talking to people.
This is very interesting and obviously contradicts the received wisdom that telephone polls are better than those on the internet. That may be something to do with the clarity of the question in a single issue referendum, so i am not sure it will hold for all-time, but nonetheless it is fascinating.
Your analysis suggests a very stark and persistent shift away from Remain from around the end of May. That appears to coincide extremely closely with the publication of the latest Migration Statistics by ONS (on 26th May) which received blanket media coverage on the day, and were very clear in giving weight to one side of the argument. Do you agree that this news may have been a significant contributor to the sharp rise in support for Leave from that point up to the murder of Jo Cox?
I think this misses the point that if one option is deemed socially unacceptable people will lie on surveys as they include a lot of personal information and they are afraid of repercussions.
In the Scottish referendum “No” was deemed socially unacceptable with supporters being attacked by nationalists. Therefore in surveys, especially those conducted on the phone, people said they were voting for independence when on the day and in total anonymity they voted for what they truly believed in – No.
The same can be said for shy tories in 2015, and Leave supporters (who were branded little englanders and racists).
absolutely … In the New Year comedy show “only an excuse” a saltire carrying, blue face painted scot along with similarly attired mates goes to vote, screams his intention to vote YES but once in the booth votes NO then indicates to his mates he voted YES to resounding screams of “FREEDOM”.
The more threatening the atmosphere – wither you were being called a traitor or a racist, the less likely youre going to indicate your intentions. pollsters are going to have to realize the more febrile the atmosphere, the less accurate their predictions will be.
Well said. These pollsters always seem to assume that people tell the truth when asked about their political preferences and voting choices. Even if they think it’s totally anonymous they may well lie. Maybe they’re even lying to themselves until they get into the polling booth.
This doesn’t take into account the fact that the polls may be influencing people’s votes. We love underdogs, we check one last time what the polls say, and we go and vote. They poll and the vote are connected and thus cannot be predicted beyond a certain degree.
Americans think the opposite and are inclined to vote for a winner if they are undecided because they want to be on the winning team and take credit for the final result.