 Chris Hanretty analyses the current bookmakers predictions for the general election 2015. The odds from Ladbrokes imply Labour will fall short of a majority, he argues.
At the time of writing, bookmakers Ladbrokes offer odds on the winning parties in 449 of the 632 mainland Britain constituencies. Betting odds offer useful information about the probability of events happening. A bookmaker that offers a return of 100-to-one on an event that has a one-in-ten chance of happening rather than a one-in-a-hundred chance of happening is unlikely to stay in business long.
In markets with multiple outcomes, fractional odds can be converted to implied probabilities quite easily. Specifically, we can turn fractional odds into decimal odds — so that odds of 11/4 become 3.75 (1 + 11/4) — and turn these decimal odds into implied probabilities by dividing one by the odds, so that 3.75 become 26.67 per cent (1 / 3.75). Because bookmakers quote odds to make a profit, the sum of implied probabilities will probably exceed 100 per cent — and so we have to divide these implied probabilities by their sum.
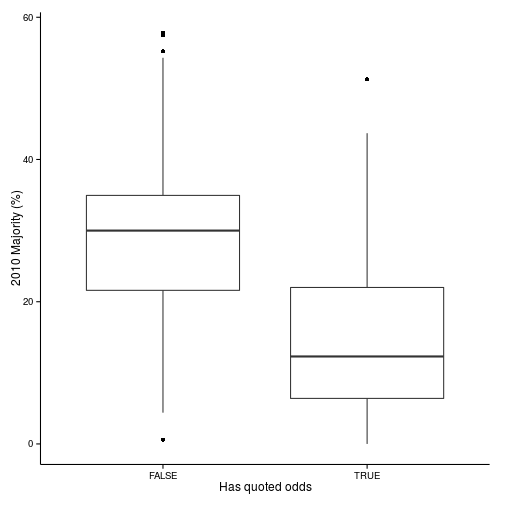
The constituencies for which we have odds for are not a random sample of constituencies. Rather, they’re constituencies which are more ‘interesting’ — in the sense of having smaller majorities. We can see that in the following box-plot, which plots the 2010 majority of constituencies with and without quoted odds.
Figure 1: Majorities in constituencies with, without odds
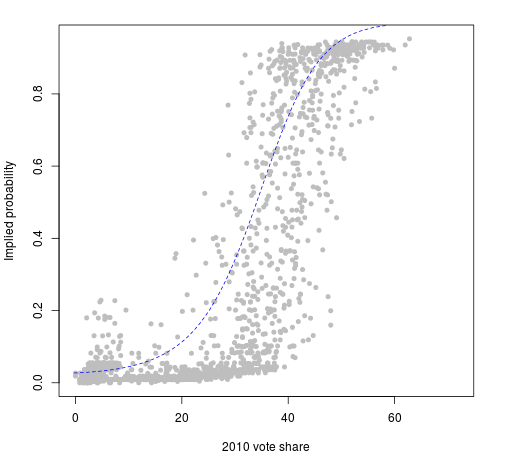
Nevertheless, we can use information from the constituencies for which we do have information to generate implied probabilities for the remaining constituencies. The plot below is a scatter-plot of the 2010 vote share of each party against their implied probability of winning, according to the odds. Overlaid is a curve from a regression model, which shows where the implied probability ‘ought’ to lie, given what we know about 2010. (Technical note: it’s a beta regression with a polynomial of order three and party dummies; the curve is a fitted curve for Labour. If we feed that regression model the 2010 vote shares for the remaining constituencies, we can get new implied probabilities out.)
Figure 2: 2010 vote share against implied probability
What happens when we add these probabilities together to get an overall prediction of the distribution of seats? We see something like the table below.
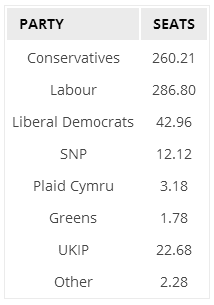
Thus, when we aggregate constituency betting markets, we get what look like remarkable over-estimates of the number of seats likely to be won by UKIP and the Liberal Democrats. This is likely due to the tendency for bookmakers to offer odds such that
“probabilities implied in the odds are too low for favourites, and too high for longshots, in relation to the frequency of winning outcomes”
In other words, bookmakers repeatedly offer 1-in-100 odds for parties like UKIP without realizing that they’re implying that UKIP should win six-and-a-half seats even if they’re at 1/100 everywhere. What’s strange is that Ladbrokes is also offering odds for Liberal Democrat and UKIP seat tallies that seem inconsistent with these constituency-by-constituency estimates. There’s an arbitrage opportunity for someone here…
We can attempt to correct for this favourite/longshot bias by using information about odds and outcomes in the previous general election. Cunningham, Sudulich and Wall have analysed the effectiveness of betting markets as predictors of seat level outcomes in the 2010 general election. Although they use Betfair data rather than odds from a bookmakers (as we do here), very often the odds from betting exchanges and bookmakers are very similar (partly to prevent obvious arbitrage opportunities emerging). By taking their data on final implied probabilities, and running another regression model which tries to transform the implied probabilities to best match who actually won the seat (technical translation: by running logistic regression using the logit transformed implied probabilities as a predictor), we can “correct” the bookmakers’ implied probabilities using the parameters estimated on 2010 data. The table below shows the results when we correct probabilities in this way, and aggregate over all seats.

The negative effect on the forecast seat shares for UKIP is dramatic — almost as dramatic as the positive effects on the forecast seat shares for the two largest parties. UKIP’s forecast seat share is still north of what is implied by the separate markets on UKIP seats, which implies that Ladbrokes’ odds aren’t entirely consistent even after correction — but the shape of this forecast is very different to that implied by the previous table.
Note: This article was originally published on the University of East Anglia’s Eastminster blog and gives the views of the author, and not the position of the British Politics and Policy blog, nor of the London School of Economics. Please read our comments policy before posting. Featured image credit: Ed Miliband CC B 2.0
Chris Hanretty is a Lecturer in Politics at the University of East Anglia.