 Lee Crawfurd and Ukasha Ramli measure the responsiveness of elected local representatives to requests from putative constituents from minority religious groups. They find that response rates are six to seven percentage points lower to stereotypically Muslim or Jewish names, with Labour and Conservative councillors both showing equal bias towards the two. Their results suggest that the bias may be implicit and that it is lower in more dense and diverse locations.
In October 2020, the UK’s human rights watchdog found Labour to be ‘responsible for unlawful acts of harassment and discrimination’. Last year, the Muslim Council of Britain called for an enquiry into Islamophobia in the Conservative Party. Other critics have accused the latter of failing to tackle Islamophobia. The 2017 British Social Attitudes Survey showed that 33% of those who identify with the Conservative Party would describe themselves as somewhat racist, compared with 18% of those who identify with the Labour Party.
We set out to gather some evidence on the extent of bias by local politicians against their constituents, using a correspondence experiment. We sent ten thousand emails to councillors with a quick question, and randomised whether they came from a stereotypically Christian name (Harry or Sarah White), Jewish name (Levi or Shoshana Goldstein), or Muslim name (Mohammad or Zara Hussain). We kept the email short in order to minimise the burden placed on our busy objects of study.
Response rates were six to seven percentage points lower to the Muslim and Jewish names – a clear evidence of bias. We don’t however see more bias against Jewish names by Labour councillors. Neither do we see more bias against Muslim names by Conservative councillors. Such discrimination in the provision of services based on race or religion is against UK law. This form of discrimination by councillors may have substantive impacts for constituents. For example councillors set policy on access to the limited supply of social housing, policies which have been documented to disadvantage ethnic minorities.
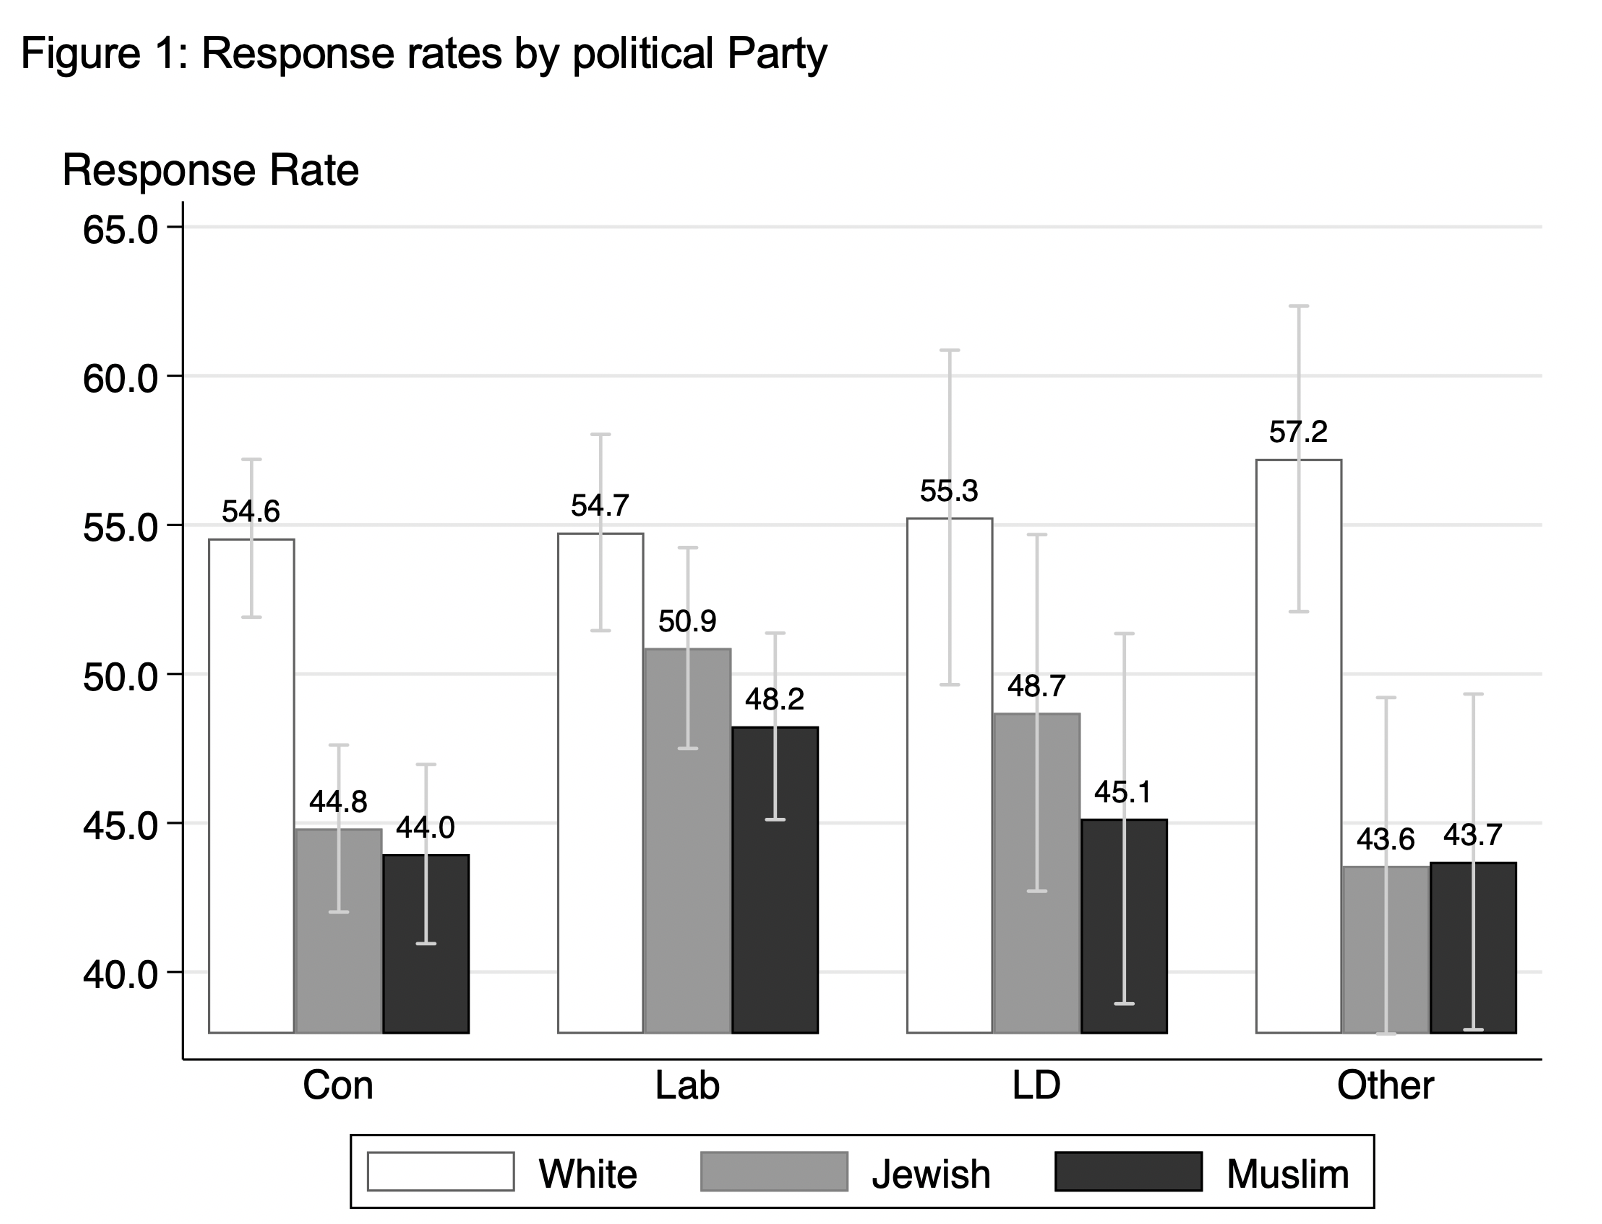
Note: Response rates are estimated after removing council fixed effects, and standardising residuals to a response rate equal to the sample average of 55 percent for whites. Bars represent 95 percent confidence intervals.
In total we received 5,093 responses to 9,994 queries sent, for a 51% response rate. This is almost identical to the response rate found by a survey of real requests to councillors, in which 51% received a response within two weeks. Amongst those who responded to our queries, the median time to response was 12 hours, and the median length of responses was 228 words.
Compared to the male Christian name (Harry White), response rates to Jewish names are 5-6% points lower, and 6-9% points lower to Muslim names. Response rates are marginally higher to the female Christian name (Sarah) than to the male Christian name (Harry). Response rates are also higher to Zara Hussain than to Mohammad Hussain.
Name or Religion?
We randomise each councillor to receive one of two email scripts. The first email script makes a simple request in line with basic councillor responsibilities – ‘I have a question about local services and was wondering if you could tell me when your surgery is held?’. The second request explicitly indicates the religion of the emailer – ‘I’m interested in organising a sponsored walk in the local area to raise money for [Christian Aid/Islamic Relief/Global Jewish Relief]. Could you advise me if I need to get some kind of permit?’.
The two email scripts can be seen as different levels of intensity of the treatment. The response rate for white names to the first email was 61%, and 45% to the second email. Bias in response rates is similar across the two types of emails. This suggests that the discrimination occurs based on the name of the sender alone. Due to the high volume and low cognitive effort of checking emails, by not replying, councillors may be acting unconsciously when exposed to non-Christian/minority group names. Alternatively, councillors may simply be consciously discriminating against minority constituents, irrespective of their degree of self-identity. Because the identity of the sender is present in the email address itself, councillors might choose to not even open the emails from names associated with minority groups.
What explains the bias?
Bias in response rates is largest against Jewish and Muslim names in the least densely populated rural locations, with small non-white populations (Figure 2). One reason for this could be that councillors in white areas are more likely to be white themselves. On average we see much lower bias by councillors with names estimated to be Jewish or Muslim (though these estimates are imprecise due to the small number of such councillors). There may also be other differences in the selection of candidates with different levels of unobserved racial and religious bias in rural and urban areas. Alternatively, councillors may respond to political incentives and be less likely to respond to minorities in locations where minority groups are a small proportion of the electorate.
We test responses to electoral incentives directly by showing the relationship between response rates and two measures of competition – the margin of victory at the last election and the number of days until the next election. We see now less bias in close elections. Finally, lower bias could be attributed to the degree of ‘contact’ councillors have with different minority groups. Councillors in more diverse urban locations may show less discrimination through an erosion of prejudice as described by the contact hypothesis, though we are unable to test this hypothesis directly.
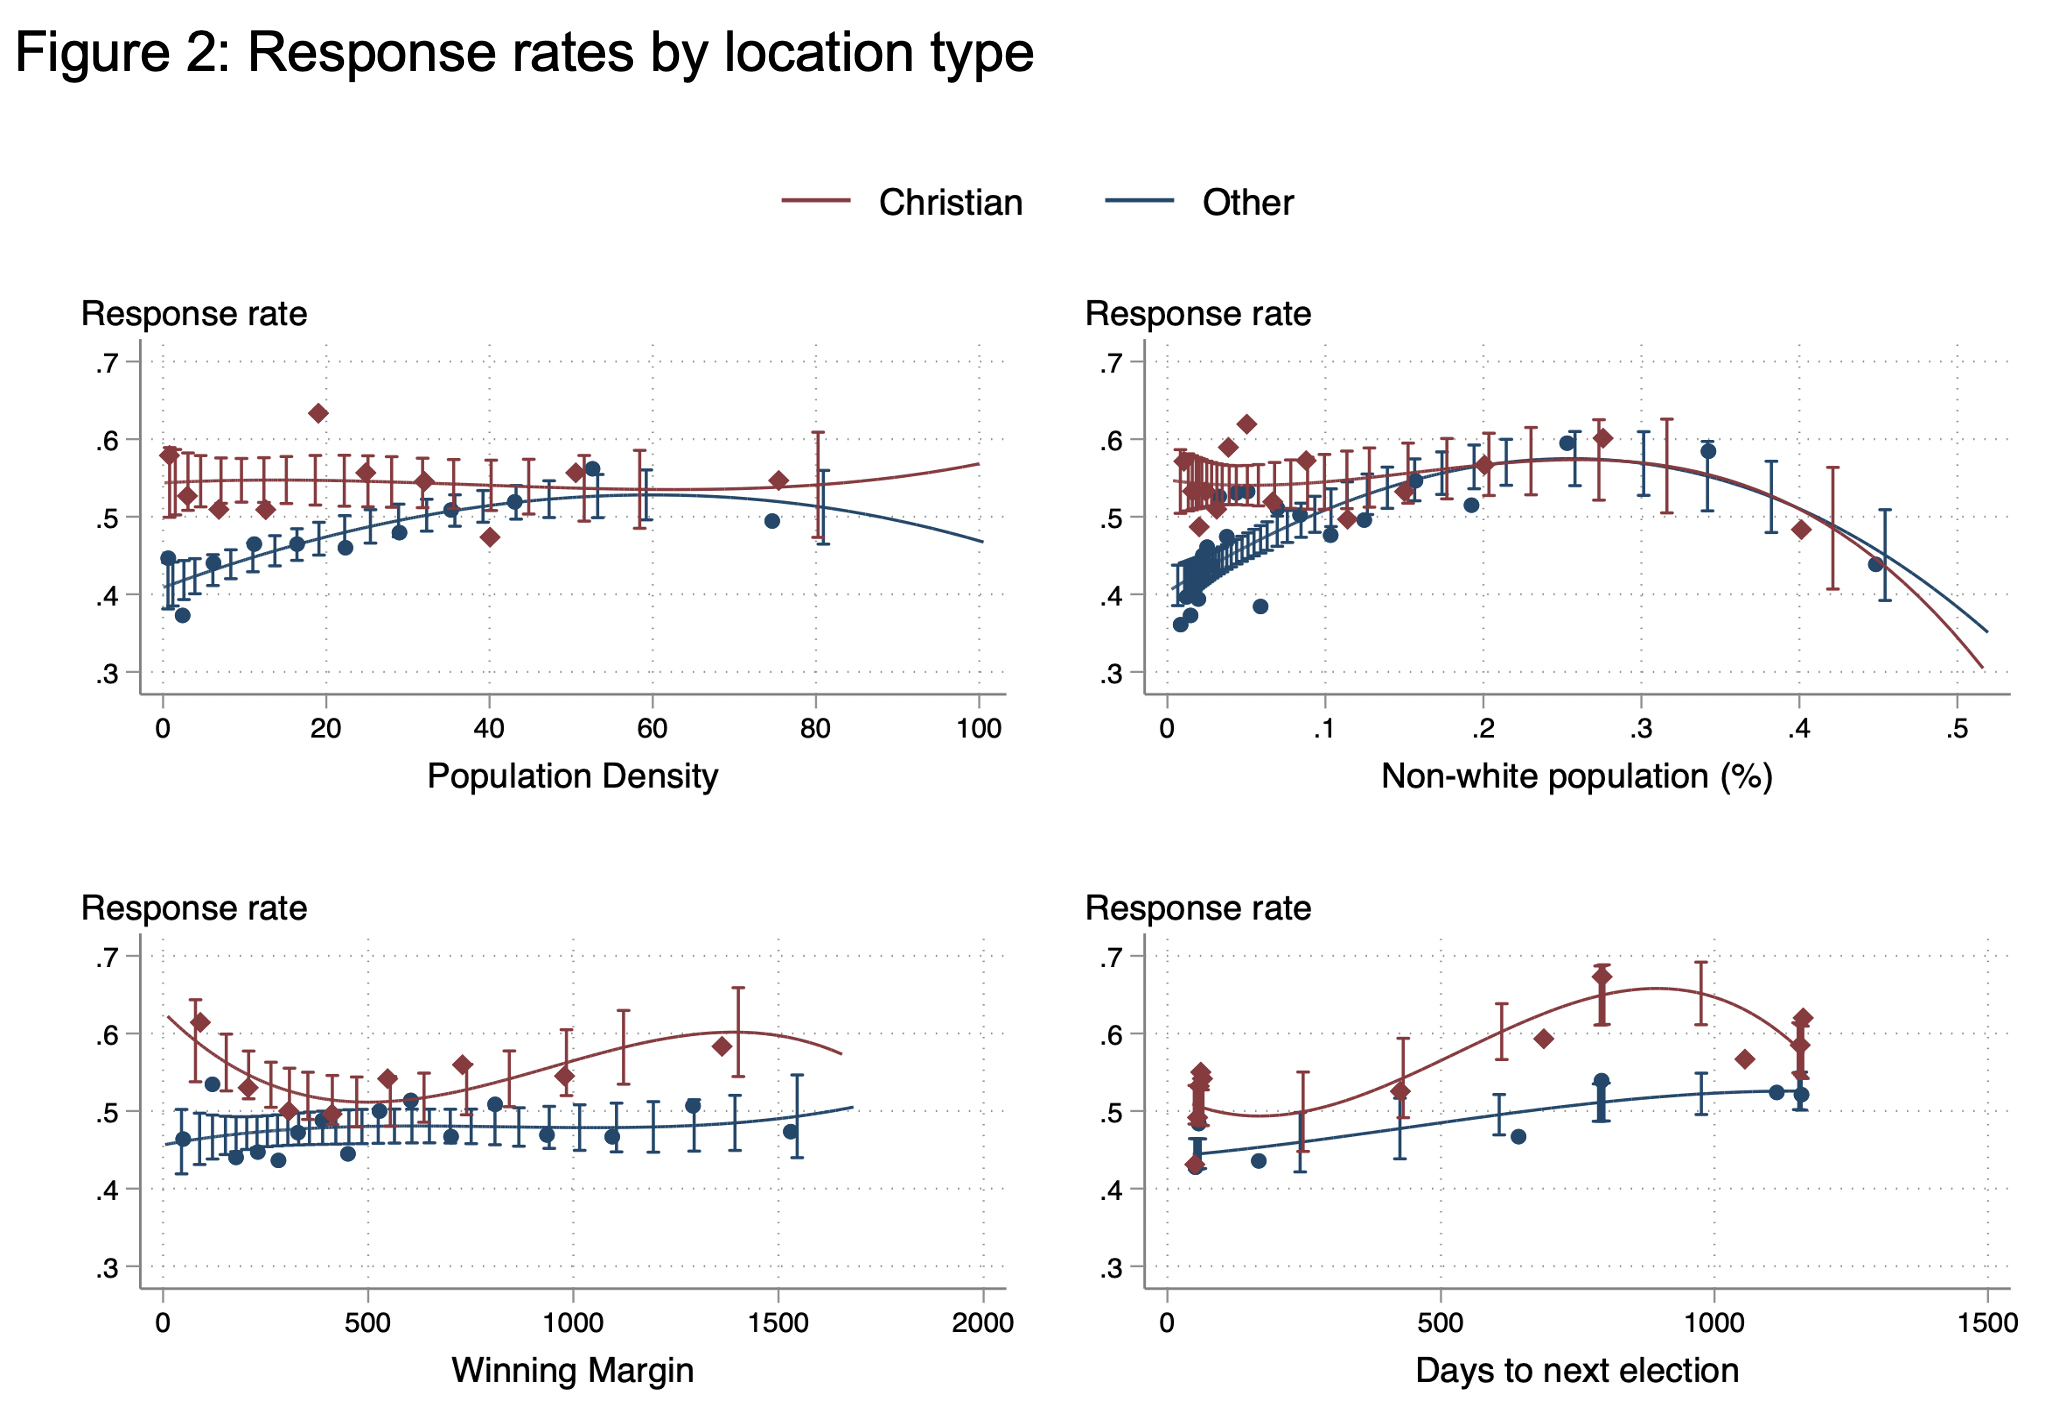
Note: The top-left figure shows a binned scatterplot of response rates against population density, by whether the sender name was Christian or non-Christian. The top-right figure shows response rates against the non-white population share. The bottom-left shows the response rate against the winning margin of the elected councillor at the last election. The bottom-right shows the response rate by the number of days until the next election. Fitted lines are polynomial regressions of order three, with bars showing 95 percent confidence intervals. Population density and non-white population shares are calculated at the ward (sub-council) level from 2011 census data. On average there are three councillors in each ward. Population density is expressed as residents per hectare.
Conclusion
We find evidence for bias from local politicians in response to requests for basic information from ‘Jewish’ or ‘Muslim’ constituents. Despite the media narrative of anti-Semitism in the Labour party and Islamophobia in the Conservative party, our results suggest that both parties are equally discriminatory to both minority groups. This discrimination seems to occur based on names alone, and is unchanged by the explicit identification of religious identity. These effects are largest in rural areas (with low population density) and with small non-white populations. Councillors in such areas may have fewer opportunities for positive interactions with minority groups.
This work demonstrates that even access to basic services are susceptible to forms of discrimination, and that minority group members may struggle to be heard through this process. Reducing councilor bias could be attempted through training designed to reduce implicit prejudice. The leader of the Labour Party has announced the party’s commitment to undergoing this type of training, though more research is needed into the effectiveness of such training. Future studies may benefit from further investigating the process through which politicians engage with their community, and identify ways in which to reduce these biases.
___________________
Lee Crawfurd is a Senior Research Associate at the Center for Global Development.
Ukasha Ramli is a PhD student at the LSE Department of Psychological and Behavioural Science.
Photo by Markus Spiske on Unsplash.


The differece between the response rates from Labour councillors to white constituents and jewish constituents is 3.8%, whilst the differece between the response rates from Conservative councillors to white constituents and jewish constituents is 9.8%.
The 3.8% is important enough to be potentially criminal.
But the 6% difference between those two figures is dismissed as statistically insignificant.
Why is that?
I would further add that no attempt appears to have been made to factor in the racial disparities between the named religious groups in the UK and the possible affect on results this could have in drawing conclusions about the reasons for bias.
B
Aside from the origin of the name Sarah having Jewish connections the use of the word White in the first bar graph makes it look like the bias is towards White people. You do not use the chosen Jewish or Muslim surnames for some reason. Is this because of a conscious bias in the researchers, a deliberate misrepresentation to reinforce a predetermined message, to manipulate the conclusions, or just poor presentation?
You have also chosen an interesting colour scheme in that graph with the White surname using white, the Jewish one using grey, and the Muslim one being black. This could further distort the meaning of the graph and how it might be viewed and understood by it’s poor presentation.
These chosen methods of presenting evidence certainly raises the issue of whether the reader might falsely get a subconscious message about what these columns represent. If this isn’t the result of the researcher’s own subconscious bias or a deliberate misrepresentation then it’s certainly a very poor way to present results.
I would also take issue with another inconsistency that may affect the results gathered. The Islamic aid organisation named is the only one that isn’t a British Charity. Both the Christian and Jewish ones are British charities. Surely every effort when researching should be made to eliminate leading the respondent and all the inconsistencies I’ve listed could certainly affect the validity of the researchers findings?
Whilst pointing out these issues it may well still be the fact that there is a bias in councillor’s responses although the reasons for this may not be as presented here. It could be the case that councillors from a Christian culture may wish to take more time in researching aid groups they aren’t familiar with so that they may actually do the opposite of this research’s findings namely to avoid being seen as discriminatory through lack of community knowledge. It may also be that they are trying to avoid potentially endorsing groups that may bring them into question driven by lack of knowledge.
I would also say that for research methods it may be problematic using groupings for comparisons that differ in make us such as whether they are just a religious group or a religious and racial group. In fact, in the report above, mentions of religion and ethnicity are interchanged but only by introducing the term ‘White’ where no such mention of other skin colour relating to participants exists. Furthermore, there appears to be no attempt to determine the councillors religion or ethnicity which surely might have a bearing on response and ultimately conclusions drawn.
My personal belief is that with correct research methods being applied the results may be similar to these shown above but for me there are glaring holes in the research methods and presentation of results used that could throw doubt on the conclusions drawn. This is a pity because it could be used to undermine the conclusions even if they are on the right track.
Can you please post up your research methods and results in full so we can accurately determine the credibility of the conclusions?
Thanks.
Bill
Thanks for the comments.
Bill – the full paper is linked from the blog, you can find it here: https://osf.io/preprints/socarxiv/tc42s/
Islamic Relief is British, it was founded and is headquartered in Birmingham, but our results are similar for emails that don’t mention any charity directly.
The paper does include an attempt to estimate councillor ethnicity.
Just a point to note, I used to work in my LA as support officer for Councillors and at that time requests such as the ones you used were not dealt wit by elected members but by officers. This may have changed but might also have skewed your results?
That’s great insight, thanks for sharing. If this is true, then maybe our conclusions may not be applicable to councillors specifically, but to employees in local authorities. Or more specifically, email responders at local authorities. However, just to note, we did receive a lot of email responses from councillors themselves.
Can I ask why the SNP is lumped in with ‘other’ when it is the third largest party in the UK?
Our sample was mostly from England and Wales, which is why the SNP were not as represented