 Now in our second week of the general election campaign, the polls continue to shift, with the Conservatives and Labour gaining ground, and the Liberal Democrats and Brexit Party on a downward trajectory. In his second blog of the campaign, Joe Greenwood considers these changes with reference to movements in support in the previous three general elections.
In my blog last week, I noted that one of the major questions facing election prognosticators is whether or not we will observe campaign effects that shift party support in the 2019 general election. We’re now in a position to start observing this, but it is worth doing so with reference to examples from the recent past. Each poll is a snapshot of public opinion at the time its questions were asked and will be influenced by the quality of the sample and decisions made by the polling company, for instance about how to ask questions or weight their data. As such, it is sensible to refer to average polling figures, or polls of polls, such as those produced by the BBC and political scientists. These are showing that the first week of the general election campaign, and indeed the week preceding it, have seen a shift in voting intention towards the Conservatives and Labour, and away from the Liberal Democrats and the Brexit Party, though only by a few percentage points.
But will this continue for the next three-and-a-half weeks until polling day? In order to answer this question, it is worth looking at what happened in the equivalent periods during the last three UK general elections. For each of those contests, the below chart shows the shift from the average of voting intention polls with four weeks to go to the average on the last day before the election. I compare polls against polls, rather than against the election results, because we are interested in change when using the same measure. Also, given the flaws with the polls in 2015 (too many Labour voters in the samples, and an over-estimation of turnout amongst young people) and 2017 (not enough Labour voters in the samples), comparing them against the actual election results would exaggerate the change in public opinion over the campaigns.
Figure 1: Change (%) in average polling levels of support for parties over the final four weeks of the campaigns.
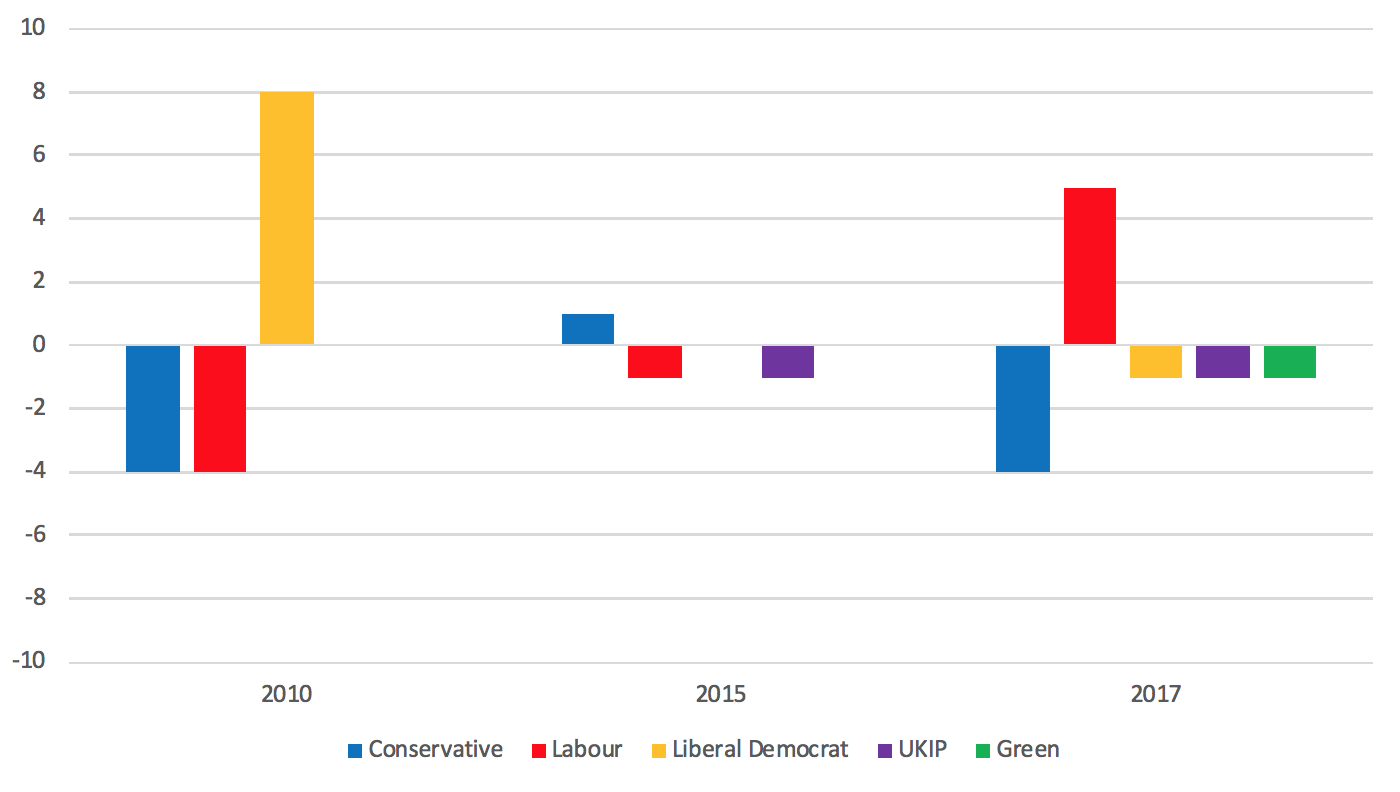
In 2010, the most dramatic shift during this period was towards the Liberal Democrats (remember ‘Cleggmania’?), though of course the final polls notably overestimated support for the party. Nevertheless, it is clear that there was a shift in voting intention towards the Liberal Democrats and away from the Conservatives and Labour during the 2010 campaign (UKIP and the Greens were subsumed in ‘other parties’ at the time). This was not the case in 2015, when there was no meaningful change in the average voting intention for any of the parties over the last four weeks of the campaign. It was a similar story of no change for the Liberal Democrats, UKIP, and the Greens in 2017, but the Conservatives saw a sizeable decline in support that was matched by the rise in support for Labour.
Labour will, of course, be hoping for an increase in support in the vein of 2017, when their estimated vote rose by around 5% in the final four weeks before election day, and they then saw the last polls underestimate their share by an additional 4%. Three things make a repeat of this scenario unlikely, however: time, opponents, and updated polling methods.
In the first instance, by this time in 2017 the Labour Party was already half-way through a rise that moved them from 26% to 36% in the eight weeks after the election was called. That put them on around 31% with four weeks to go in 2017, compared to 28% with the same time to go now. Turning to opponents, it seems unlikely that we will witness a similar decline in support for the Conservatives, who are still rising in the polls (though their decline did not begin until this point in 2017). Jeremy Corbyn will be less of a revelation this time and although Boris Johnson and his colleagues have made some missteps, they appear to be maintaining their gains from the Brexit Party (even if the deal between the two parties does not affect key Labour marginals that the Conservatives need to win). They will, of course, still need to continue their upward trajectory in order to reach or surpass their vote share in 2017 (which they are currently 4% below). The Liberal Democrats have the opposite trajectory but sit 7% above where they were at this stage in 2017, and 10% above their final vote share. Finally, pollsters know that inaccurate polling is bad for business. As such, they examine the causes when their figures don’t reflect actual results, and then make changes to their methodologies. Indeed, the underestimation of the Labour vote in 2017 was in part a consequence of the adjustments made in light of the overestimation of the Labour vote in 2015. Thus, it is less likely that the pollsters will be underestimating the Labour vote this time than in 2017.
How much will the polls change over the coming weeks? Both the Conservatives and Labour seem likely to continue their rise, meaning that the former could reach or exceed their 2017 vote share from their current levels of support. Labour, however, needed longer than they currently have available to realise their impressive gains in 2017, and cannot count on pollster lowballing their support this time around. They are also confronted by a more difficult Conservative opponent and a Liberal Democrat party that is more popular and will probably attain a higher level of support than in 2017, despite its current downward trajectory. This all presumes that the trajectories remain roughly the same as they are at the moment, but plenty could happen between now and 12 December to alter them.
________________
Joe Greenwood is a LSE Fellow in the LSE Department of Government, where he teaches on GV101 (Introduction to Political Science). He previously worked at YouGov and, before that, completed his PhD at the University of Essex. His research focuses on political participation, privilege, and perceptions in the British context. He tweets @niceonecombo.


Since this article was written 2 days ago the Conservitives are just 2% away from 2017 – How quickly things are changing – I would love an update to this article soon?
It’s fascinating to watch – every time we get the promises from both sides and I think the public have lost a lot of faith and don’t really know who to vote for anymore. I can’t wait to see how it turns out.