
 How would the main political parties gain or suffer in future Alternative Vote (AV) elections, if UK voters approve changing systems in the May 2011 referendum? David Sanders, Paul Whiteley and colleagues have authoritatively replayed the May 2010 general election. The Liberal Democrats would have been the big gainers, winning many more seats and no longer being reliant on the Conservatives alone to form a majority coalition government Two thirds of seats lost would have been from the Tories and one third from Labour.
Both before and after the general election in May 2010 many commentators were asking what the result might have been had British voters used the Alternative Vote system rather than the current ‘first past the post’ (FPTP) system. The LSE’s Simple Guide to Voting Systems makes clear that AV allows voters to express multiple preferences and can alter results in seats where the current MP does not have the support of a majority of voters.
Our detailed research for the British Election Study at the University of Essex suggests that AV would have cut 22 MPs from the Conservatives ranks, and a net total of 10 MPs from Labour – as shown in our first chart below. The Liberal Democrats tally of seats would have been 89 (up 32). The other parties’ seat numbers would have been unaffected. This outcome would have radically changed the arithmetic of post-election coalition formation. In effect, the Liberal Democrats would have been able to form a majority coalition with either Labour or the Conservatives.
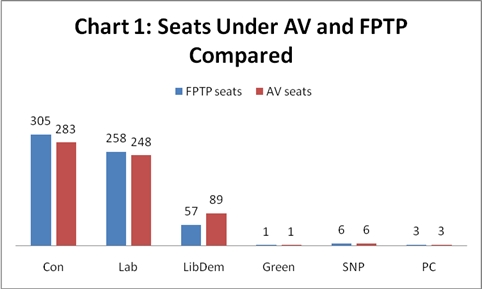 Source: British Election Study, University of Essex, 2010
Looking a little bit closer, our second chart below shows that there would have been somewhat more underlying movement of seats, with Labour losing 19 seats to the Liberal Democrats, but also retaining 10 close-fought constituencies that the Conservatives in fact won. The Tories would only directly lose 13 seats to Liberal Democrat challengers, but would end up further down than Labour. (To see what these seats changes would have been in detail, see Annex 1 at the end of this blog).
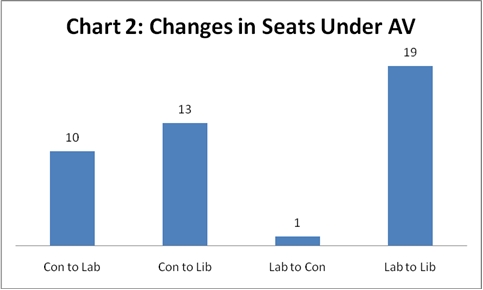 Source: British Election Study, University of Essex, 2010
Our research is based on the responses to a large, representative survey of the British electorate conducted immediately after the general election. Some 14,000 respondents in England, Scotland and Wales were asked both how they actually voted in the election and, using a simulated ballot form, how they would have voted in a comparable AV election. The form varied across the different UK countries to reflect the distinctive party systems that now exist. In each case voters were asked to rank up to seven party candidates. We found that most of those who expressed a first preference also indicated a second preference and we used this information to produce second preference distribution ratios for each party in each country.
– For Labour voters in England we were able to show that fully two third (66 per cent) chose the Liberal Democrats as their second preference, 16 per cent chose the Green Party; 9 per cent chose UKIP, 7 per cent the Conservatives and just 3 per cent chose the BNP.
– Amongst Liberal Democrats in England, only 40 percent of their voters chose Labour as their second preference, and 27 per cent opted for the Conservatives, 21 per cent for the Greens and 12 per cent to UKIP.
– Over half (54 per cent) of Conservative supporters in England chose the Liberal Democrats as their second preference, 29 per cent UKIP, 7 per cent Labour, 6 per cent the Greens and 4 per cent the BNP.
We explored the possibility that the distribution ratios varied across regions or across different types of constituency but found that the ratios were very similar regardless of different contexts.
Finally we simulated the AV procedure by applying these distribution ratios to the actual numbers of votes that the different parties received in the General Election. This enabled us to calculate an ‘AV winner’ in each constituency (apart from those in Northern Ireland) and to compare it with the actual ‘FPTP winner’.
The obvious caveat to make about all of this is that the second preference distribution ratios we used were calculated from a 2010 survey. Our respondents had not been exposed to media commentary or campaigns by political parties that might have sought to inform and even instruct voters about how to cast their second and third preferences. How people form and articulate their preference formation might prove very different when everyone knows in advance that AV is the actual ballot method.
A further complicating factor is that the experience of a Conservative-Liberal Democrat coalition government may already have produced significant changes in the second (and third) preference distribution ratios of many voters. Studies replaying the 1992 and 1997 general elections also suggested that at these times too AV would have modestly boosted Liberal Democrat seats, but would also have helped Labour and reduced Conservative representation. However, by 2014 or 2015 coalition party voters might be more likely than in 2010 to support candidates of the other coalition party where their first choice could not win. And by this time Labour and Liberal Democrat links might be much weaker than they were in 2010.
If the referendum result returns a ‘Yes’ verdict, both the political parties and voters will need to think hard about how they can maximise their interests under the new Alternative Vote system.
For more information see David Sanders, Harold Clarke, Marianne Stewart and Paul Whiteley, ‘Simulating the Effects of AV in the 2010 UK General Election’. British Election Study Working Paper, University of Essex, July 2010.
Annex 1: A list of constituencies that would have changed hands in 2010 as a result of an AV voting system
| Labour to Conservatives - 1 seat | |
| Dudley North | |
| Labour to Liberal Democrats - 19 seats | |
| Aberdeen South | Edinburgh North and Leith |
| Edinburgh South | Newport East |
| Swansea West | Ashfield |
| Birmingham Hall Green | Bristol South |
| Chesterfield | Durham City |
| Hull North | Islington South and Finsbury |
| Lewisham West and Penge | Newcastle upon Tyne North |
| Oldham East and Saddleworth | Oxford East |
| Rochdale | Sheffield Central |
| Streatham | |
| Conservatives to Labour - 10 seats | |
| Aberconwy | Cardiff North |
| Brentford and Isleworth | Broxtowe |
| Hendon | Hove |
| Lancaster and Fleetwood | Sherwood |
| Stockton South | Warrington South |
| Conservatives to Liberal Democrats - 13 seats | |
| Montgomeryshire | Bristol North West |
| Camborne and Redruth | Colne Valley |
| Harrogate and Knaresborough | Newton Abbot |
| Oxford West and Abingdon | Reading East |
| St Albans | Truro and Falmouth |
| Watford | Weston-Super-Mare |
Click here to comment on this article.


The profound failing of this study, as of all similar studies, is that it ignores the most important effect of all of AV – the way that it alters FIRST PREFERENCE voting behaviour. Look at Australia: look at how AV has increased first preferences for the Green Party, because the tactical voting and wasted vote arguments are no longer effective against Greens, under AV.
I don’t think that’s true. The “working paper” suggests otherwise at least.
But then it was done in hindsight. And I suspect you have to look at changes in voting behaviour over the course of several elections.
please look at table 2 of th study
This is very interesting, and I thank you for this work.
One point of interest (where I have a vested interest!) is Brighton Pavilion, where the Green Party gained the seat from Labour. Your chart suggests that using AV the green party would still have a seat, and I assume that this would be Brighton Pavilion.
However using your calculations on the split of the Conservative vote and the Lib Dem vote, I come to a different conclusion.
Labour get a 40% gain from Lib Dems, whilst the Green Party get just 21%, so Labour make a net gain of 19% out of the Lib Dems. In Brighton Pavilion they totalled 7159 votes, meaning labour get a net plus of 1360.
Labour get a 7% gain from Conservatives, whilst the Green Party get 6%, so Labour make a net gain of 1% out of the Conservatives. In Brighton Pavilion they totalled 12,259 votes, meaning labour get a net plus of 123.
The total net gain for labour over the greens is 1483. The majority was only 1252, so the new majority would have been 231 for Labour!
I believe the BES model is regional, so it may be in the south east that the transfer patterns were different. I suspect this is the case.
Anyway, the high profile of the Green campaign in Brighton Pavilion would probably have changed transfer patterns and consolidated Caroline Lucas’s vote.
When I ran the results through my AV ready reckoner based on the All England 2nd Preference allocations there was only a few hundred votes in it. Certainly a fine enough margin to be affected by regional variations.
you must remember that not all these second preferences count! firstly you must eliminate UKIPs Nigel Carter as he came in last place and re-distribute his votes.