 The presentation of data on NHS expenditure is flawed, writes David Rowland, which prevents policymakers from having a clear understanding of where money within the system is going. He estimates that in 2018/19, the amount spent by NHS England on the independent sector was around 26% of total expenditure, not 7% as widely reported.
Claims regarding the extent of NHS ‘privatisation’ ought to be easily settled by referring to the official data contained within the Department of Health and Social Care’s (DHSC) annual report and accounts. These accounts, which set out how much is spent by the NHS in England in the independent sector have nonetheless been inconsistent and difficult to interpret. Following a comprehensive review of six years of these accounts our view is that the presentation of this data is seriously flawed and requires revision.
The 7% figure
The settled view in the media is that around 7% of NHS expenditure is spent by the NHS in the independent sector to purchase healthcare for patients. The source of the 7% figure is a table which has been included in the Department’s annual report and accounts each year since 2014-15, which details all expenditure on healthcare provided by ‘non-NHS bodies’. A combined version of all the entries contained within these tables is set out in Table 1 below.
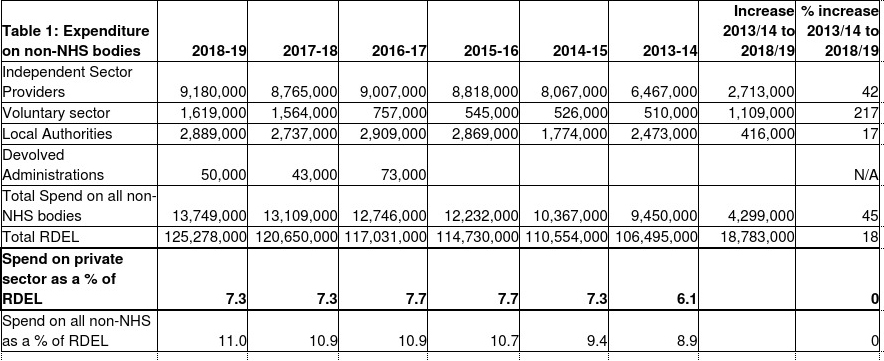 Note: RDEL stands for Departmental Expenditure Limit. The data is taken from departmental accounts and annual reports.
According to this table, in 2018-19 around 7% of total NHS expenditure goes on ‘private providers’ and this figure has remained remarkably stable over the course of a six-year period. Whilst the table includes data relating to expenditure on the voluntary sector and payments to local authorities and to the devolved administrations, the 7% figure is arrived at by excluding any money paid to any of these types of recipients.
The distinction between expenditure on different types of non-NHS bodies does not stand up to scrutiny
However, there are a number of serious flaws with this presentation. The first is that the distinction between expenditure on non-NHS healthcare in the ‘independent sector’, the ‘voluntary sector’, the ‘private sector’, and ‘local authorities’ does not stack up and on this basis there is no reason for the DHSC to exclude payments to either local authorities or to the voluntary sector from their calculations. This is for the following three reasons.
First, when asked to provide a definition in Parliament of the ‘independent sector’ for the purposes of these accounts, the government was unable to do so. Instead, it provided examples of the types of companies which fall into this category which range from small nursing homes to large multi-national private hospitals.
Second, the payments made by the NHS to local authorities worth £2.8bn last year are in fact payments which end up in the independent sector. A Freedom of Information Act response provided by the DHSC in August 2019 confirmed that the purpose of these payments was so that local authorities could commission nursing care and social care (known as either Funded Nursing Care or Continuing Health Care) almost all of which is provided by the independent sector.
Third, the definition of voluntary sector when it comes to healthcare is not, in fact, a distinct business sector. Indeed, some of the major ‘private’ providers of healthcare– such as BUPA and Nuffield Health – are not-for-profit companies; in the care home sector, the not-for-profit companies often turn a relatively healthy profit. Similarly, a large number of all private hospitals are also registered as charities.
Major items of expenditure on the private sector which are detailed in the accounts are excluded from the DHSC’s calculations.
The second major flaw with table 1 is that – as the government has acknowledged – it excludes a number of items of expenditure by the NHS which are detailed in other parts of the Department’s own accounts. Instead, it focuses primarily on the expenditure by the local parts of the NHS – Clinical Commissioning Groups.
The first item which is excluded is the amount that NHS Trusts (i.e. hospitals) purchase from the independent sector, expenditure which goes mainly towards funding elective care for NHS patients (such as hip operations). In 2018, this was £1.3 billion and is one of the biggest growth areas in expenditure on the independent sector.
The second item which is excluded is expenditure by NHS England from its central budget on primary care services, which in total amounted to £14 billion in 2018/19. Yet, most NHS primary care services are provided by the independent sector in one form or another, whether these are the high street pharmacy services provided by Boots or Lloyds Pharmacy, optical services provided by Specsavers or Vision Express, or dental or General Practice services delivered by independent contractors to the NHS.
Whilst there is a genuine debate to be had as to whether or not the provision of General Practice falls within the definition of the independent sector given that they derive almost all their income from the NHS it is odd not to categorise companies like Specsavers or Boots as independent sector providers.
The third item which is excluded is the amount which NHS England spends on social care which was around £830m in 2018. Again, the independent sector provides the vast majority of social care in England and so any payments made by the NHS for social care should also be classed as expenditure on the independent sector.
The final major flaw with the presentation of the data in the table is that it calculates expenditure on the private sector as a percentage of the total budget available to the DHSC rather than the NHS. Yet the total DHSC budget contains funds for items in addition to the NHS, such as paying for regulatory bodies and running the Department itself. Using this much larger figure has the effect of making the total spend in the independent sector look smaller as a percentage of overall expenditure. Instead, the correct denominator here should be the actual total expenditure by NHS England each year. This is because NHS England cannot spend money on the private sector which is not available to it.
The correct presentation of the data
In order to correct these flaws, we have put together a presentation of the data contained within the DHSC accounts which we believe captures more accurately the global expenditure by the NHS on the independent sector between 2013/14 and 2018/2019.
In doing so we have used the following definitions: first, we have included expenditure both by Clinical Commissioning Groups and NHS Trusts on the independent sector, local authorities and the voluntary sector; second, we have included all expenditure on primary care services which are delivered by independent contractors; third, we have included all expenditure by the NHS on social care; and fourth, we have used the total expenditure by NHS England each year rather the total amount of funds available to the Department in calculating the overall percentage.
On this basis, we find that in 2018/19 £29 billion was spent by NHS England on the independent sector, which is around 26% of total expenditure. This percentage of the NHS’s expenditure on the independent sector has stayed fairly constant for the past six years. If General Practitioners are excluded from this calculation, the figure is £21 billion or around 18% of total expenditure on the independent sector.
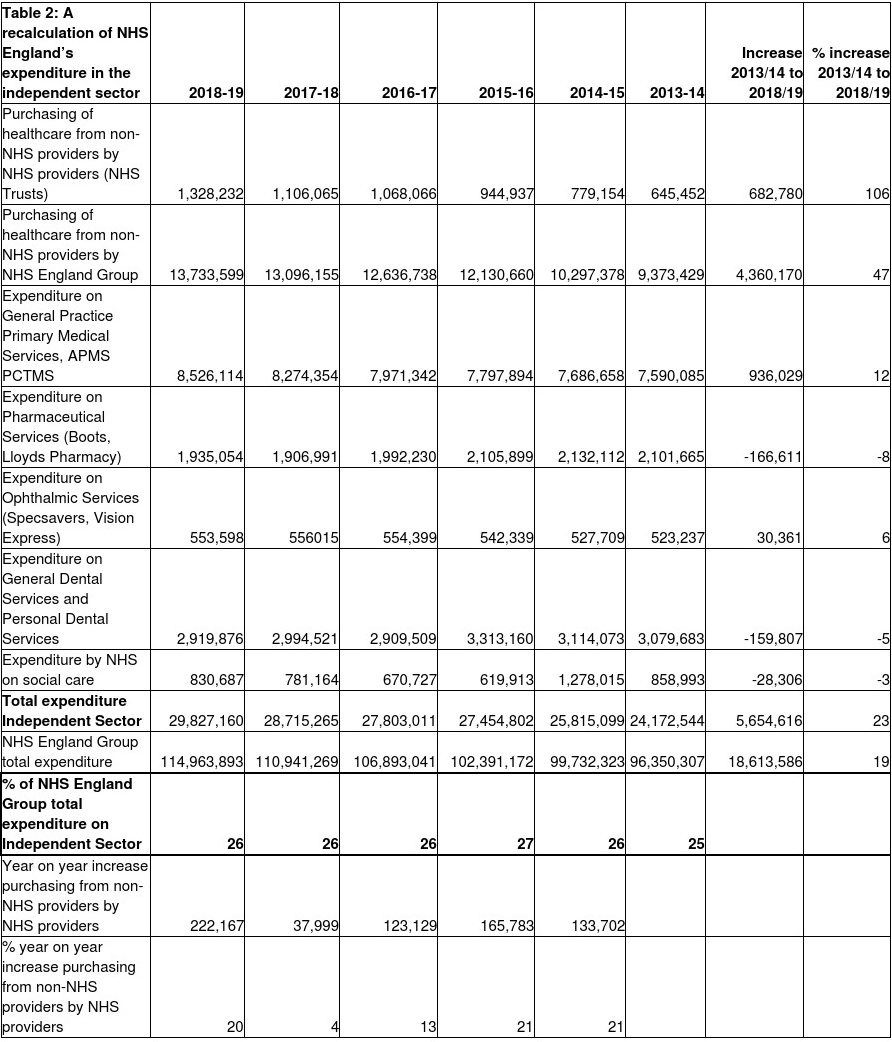 Note: the data is taken from Departmental Group Detailed Expenditure (Material Items) accounts 2014/15 to 2018/1.
In total, between 2013/14 and 2018/2019 an additional £5.6 billion of NHS England’s budget went on the independent sector – an increase of 23%. In the main, this overall increase in expenditure on the independent sector is due to the increase in the amount that local Clinical Commissioning Groups (£4.3bn) have purchased from the independent sector. Most other areas of expenditure on the independent sector – for example Primary Care Services – have not increased substantially. The reported increase in the voluntary sector spend is due to a change in how the DHSC accounts classified this type of expenditure rather than their being any significant actual increase in this area of spend.
Conclusion
It is important to have a reliable estimate of annual expenditure by the NHS in the independent sector so that policymakers can those businesses and organisations which provide publicly funded healthcare to account. Our earlier research estimated that there were around 53,000 individual contracts which underpin flow of money between the NHS and the independent sector. We now estimate that these 53,000 contracts are worth £29 billion each year.
A correct presentation of expenditure also allows the media and parliamentarians to have a clear understanding of where money within the NHS system is going and the trends that are taking place. If these facts are hidden within the accounts, it limits a broader understanding of the nature of healthcare provision in England. Healthcare in England is now very much less directly provided by the NHS than most people think.
________________
David Rowland is the Director of the Centre for Health and the Public Interest. Prior to this he worked within healthcare professional regulation in the UK as the Head of Policy at three national regulators and has developed significant expertise in social care policy, NHS workforce issues, regulation, safeguarding, whistleblowing and patient safety.
All articles posted on this blog give the views of the author(s), and not the position of LSE British Politics and Policy, nor of the London School of Economics and Political Science.


One other question: could you use your method to see what the increase in expenditure on the private sector has been since 2013 when CCGs were established under the health and social care act, with an obligation to put services out to tender? Did that make any difference to the overall percentage of services provided by private sector?
Many thanks
Louise
Thank you for this David. May I ask if expenditure on private companies providing things like patient transport services, or hospital ancillary services like catering and portering are included and if not how they could be?
Also what about privatised laboratory and radiology? A huge private contract for pathology services worth over £2 billion is being put out to tender in our area of London, for example.
Finally, what about the role of private companies in supporting NHS provision such as Capita providing GP support, or Optum providing CCG commissioning support?
To get a complete picture of the role of the private sector in provision of NHS services it would be good to include all of these, though it would be difficult because I suspect these are not individually identified in the DHSC accounts. And of course there is a difference between direct provision of care and provision of management support. However it could be argued that things like patient transport and pathology and imaging are part of direct provision of care.
many thanks,
Louise
Interesting analysis – Thanks.
Is there anyway that a meaningful comparison could be made with pre 2010 data?
Thank you so much for this. I would also like to know how hospital car park charges are used and what happens to the monies from sale of hospitals, buildings etc. Can you say something about that?
Thanks very much for this David – really helpful blog – I will be circulating it to my colleagues on the board of Sheffield CCG. I note that in your amended table the voluntary sector is subsumed into the Independent Sector Category. I think I understand the reasons for this – you say earlier that the term is used too loosely and does not distinguish between big membership not for profits like BUPA that in effect operate as private sector companies and the charitable and voluntary sector that is rooted in voluntarism and often is concerned with tackling social policy deficits. Have you any thoughts about how to strengthen the profile of the VCS sector in order to encourage debate about appropriate levels of investment? Best wishes Mark Gamsu