

 Each month, the team from electionforecast.co.uk compare new constituency polls as they are released to their estimates of what polls would show in those constituencies. This allows for an assessment of the accuracy of their modeling approach. More information about the overall model can be found here. The results presented in this post use the constituency polls released by Lord Ashcroft on 17th March 2015.
For the past few months, we have been comparing Lord Ashcroft’s constituency polls as they are released to our estimates of what such polls would show from the previous day. These comparisons offer a test of our model’s ability to accurately predict what polls would show in constituencies where there has not yet been a poll.
March has seen two separate sets of constituency polls. We wrote about the first set here. In the polls released on March 17th, Lord Ashcroft revisited some of the highly marginal seats that he has polled previously. Our model makes use of these older polls to inform the predictions of what polls would show if they were held in those constituencies today. Accordingly, so long as there have not been large changes in voting intention in these constituencies that are not apparent in the rest of the country, our model should be well placed to accurately recover the current situation in these battlegrounds.
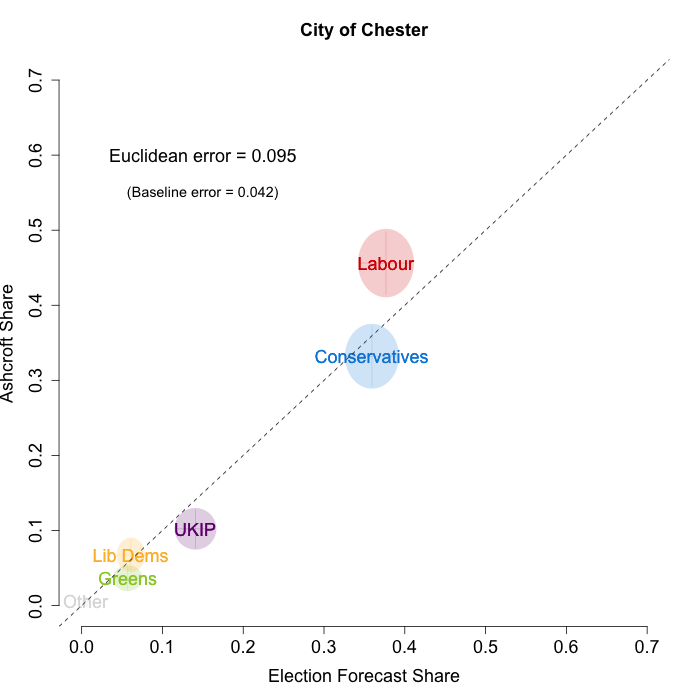
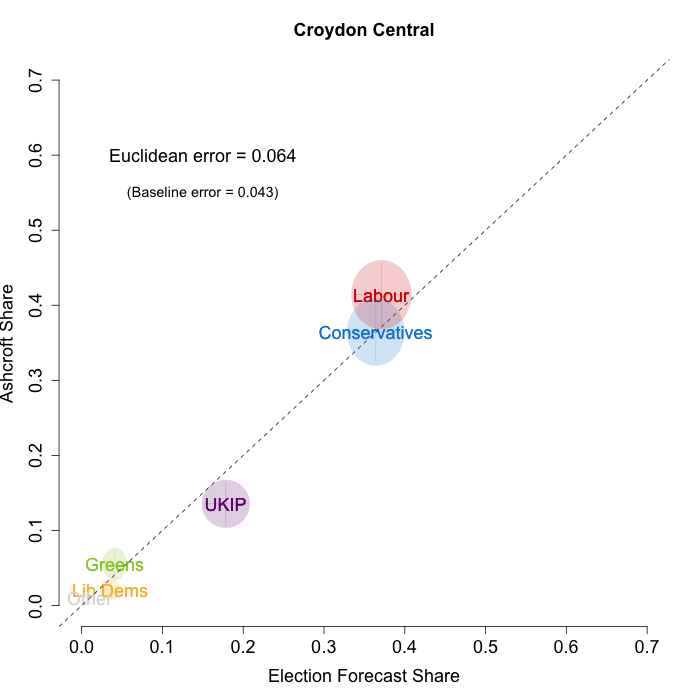
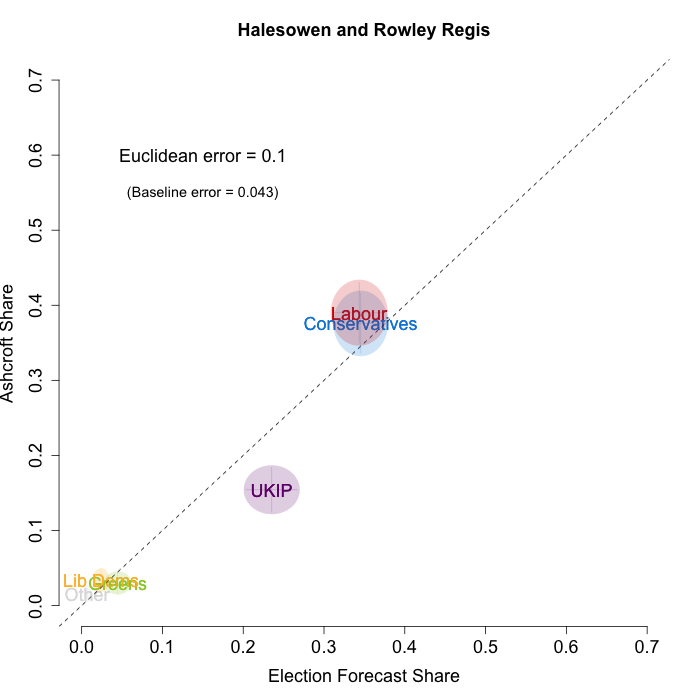
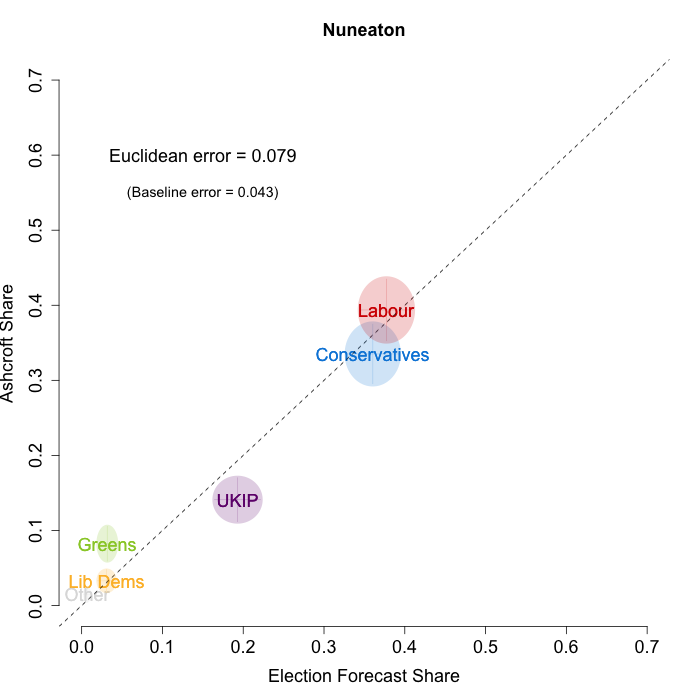
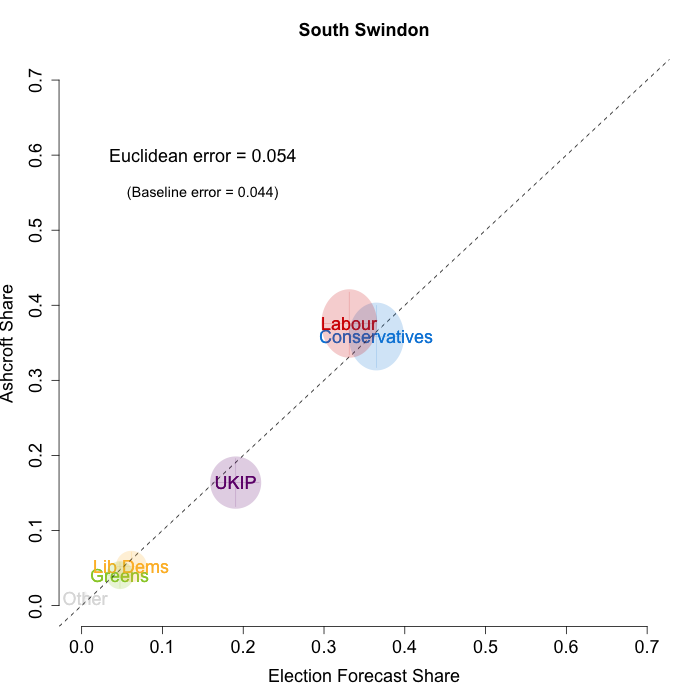
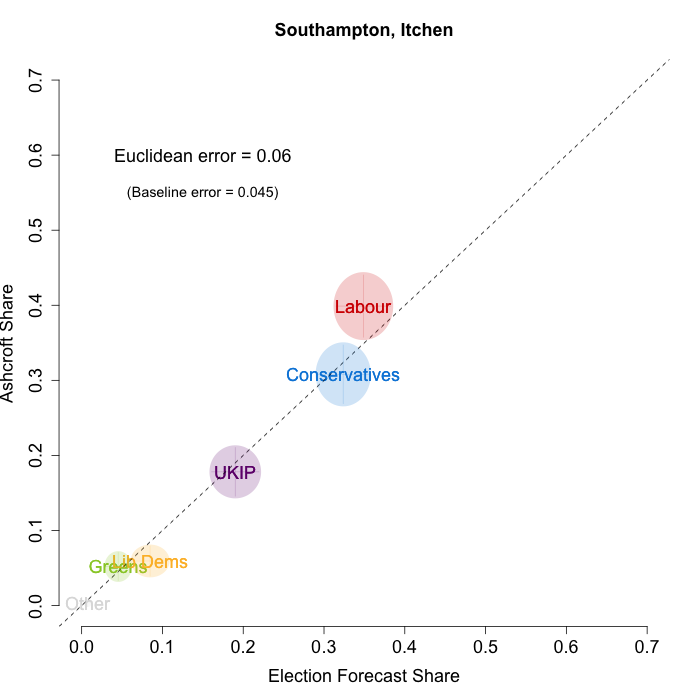
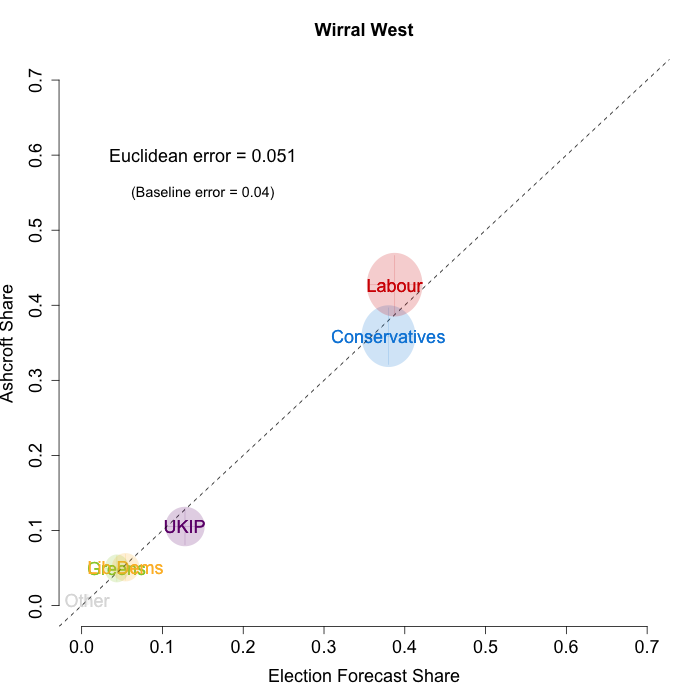
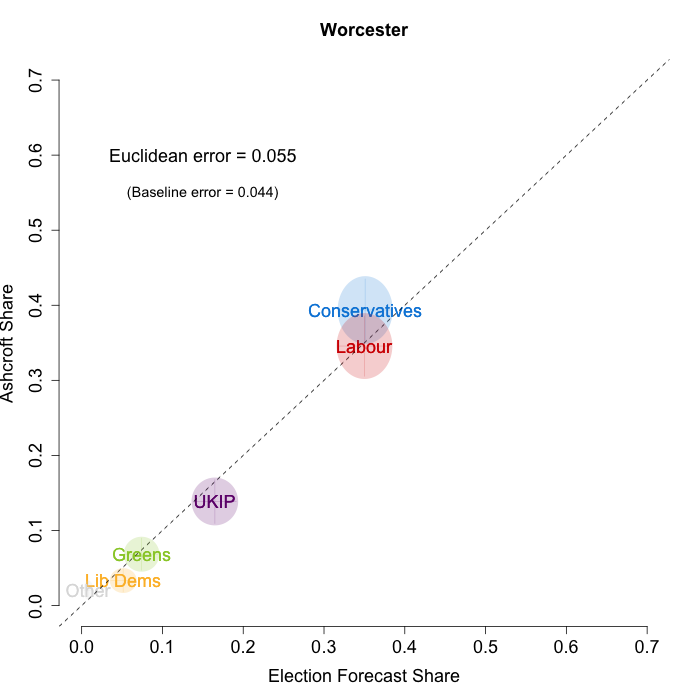
In the graphs below, we plot our estimates from 16th March for these constituencies on the x-axis and the Ashcroft estimates on the y-axis. Note that, as for previous months, our model uses the data before the application of the “spiral of silence” adjustment which reallocates survey respondents failing to give a preference to the parties they voted for at the last election.
Both the polls and our estimates include uncertainty; in the figures below we break these results out by constituency and plot ellipses capturing the joint margin of error around each point. Whenever these ellipses cross the dashed 45-degree line, we can say that our predicted vote share range for a given party, in a given constituency, coincides with the range implied by Lord Ashcroft’s polls.
We accurately recover the current state of play in most of the constituencies, and predict the “winning” party in 6 of 8 cases. The biggest errors come from our model putting UKIP higher, and Labour lower, than the vote shares implied by the Ashcroft polls. These errors are interesting because, as the keen-eyed (yet reclusive) “Unicorn” has noticed, our predictions up to now have tended to give Labour a larger share of the vote than the share measured in Ashcroft’s recent polls. In these constituencies at least, that pattern has reversed.
To measure the magnitude of our prediction errors systematically, we compute a Euclidean distance between our estimates and Ashcroft’s polls. Averaging across all constituencies, the mean distance between our estimates and Ashcroft’s polls is 7 percentage points. Given the size of the polls and the uncertainty we were calculating for our estimates, we would have expected it to be 4.3 percentage points. This suggests that in these constituencies we are a bit more overconfident in our estimates than in past months. The actual mean distance is comparable to past comparisons we have done on English constituencies, but with previous constituency polls in all the polled constituencies, the model was expecting much smaller errors.
We can also compare the performance of our model to a simpler forecasting model such as uniform national swing. As we have mentioned before, there is no single correct method for calculating uniform swing, and we use three versions that give UNS a good chance to perform as well as our own model. First, we calculate the England-only swing from our poll estimates for all of England, calculate the average swing implied by those, and then apply that average swing to each constituency’s 2010 results. If we do this, the mean Euclidean distance is 7.2 percentage points: a little larger than the 7 percentage points we calculated for our estimates.
However, we can be kinder to the UNS model by calculating the average swing from our poll estimates using only the constituencies that Ashcroft polled this round. We then apply that average swing to each constituency’s 2010 results. In this instance, the constituency-specific swing performs worse than the England-wide swing, with a mean Euclidean distance of 7.7 percentage points.
Finally, and in contrast to previous months, if we calculate the average swing across the Ashcroft constituency polling itself, and use that to apply a uniform swing, our model underperforms relative to UNS: the error for the Ashcroft-only swing is 5.8 percentage points. This final calculation is a stern test for any forecasting model, as it requires knowing exactly the average swing of the constituencies of interest. As we had UKIP systematically low, and Labour high, in this round of predictions it is unsurprising that the Ashcroft-specific UNS model outperforms our own.
Overall, these results are largely in line with the previous evaluations of our model. We are correctly predicting the winning party in most constituencies; though we remain a little overconfident in our estimates. With just 44 days until the election, we will continue to include new polling information as it is released.
 Jack Blumenau is a PhD candidate in Government at the London School of Economics.
 Chris Hanretty is a Reader in Politics at the University of East Anglia.
 Benjamin Lauderdale is an Associate Professor in Methodology at the London School of Economics.
 Nick Vivyan is a Lecturer in Quantitative Social Research at the Durham University.


