To what extent did the wealth derived from slavery contribute to Europe’s economic growth? Stephan Heblich, Stephen Redding and Hans-Joachim Voth find that slaveholding areas of Britain were less agricultural, closer to cotton mills, and had more property wealth. Not only did the slave trade affect the geography of economic development after 1750, it also accelerated the country’s industrial revolution.
Was Europe’s rise to riches built on the blood, sweat, toil and death of enslaved people? Europeans enslaved millions of men and women on the African continent during their colonisation of the Americas. Those who survived the transatlantic voyage were forced to labour on sugar, tobacco, cotton and coffee plantations in the Caribbean and North and South America. In the process, Europeans accumulated vast wealth from the slave trade itself, from plantation production and from the wider triangular trade between Europe, Africa and the Americas. Growth in Europe took off during the century when the slave trade and overseas slavery in European colonies reached their greatest scale. To what extent did slavery wealth contribute to the growth and economic development of modern Europe?
The idea that slavery and the trade in enslaved human beings jumpstarted the industrial revolution is almost as old as economics itself.
The idea that slavery and the trade in enslaved human beings jumpstarted the industrial revolution is almost as old as economics itself. Adam Smith famously saw slavery as inherently inefficient, and believed that Britain’s colonial possessions in the West Indies drained the nation’s resources. Karl Marx, on the other hand, argued in Das Kapital (1867) that modern industrial capitalism was built on the capital accumulation facilitated by slavery: “the veiled slavery of the wage workers in Europe needed, for its pedestal, slavery pure and simple in the new world… capital comes dripping from head to foot, from every pore, with blood and dirt”.
The topic has been hotly debated by economic historians. One influential line of research agrees with Marx, arguing that Britain accumulated vast wealth from the triangular trade and used this wealth to finance its industrial revolution (Williams, 1944; Darity, 1992; Solow, 1993; Inikori, 2002). In contrast, another prominent strand of work argues that profits from the slave trade were no higher than from other lines of business, while absolute levels of profit from the slave trade were small relative to the size of the British economy, such that slavery played a relatively minor role in the country’s industrial development (Engerman,1972; Eltis and Engerman, 2000; Harley, 2013).
Locating slaveholders
Most analysis of this question has looked at national aggregates. In recent work, we examine geographically disaggregated data on the impact of slavery wealth on industrial development. To do so, we use new data on the geography of slaveholding and on economic development in Britain. We combine these with a new source of exogenous variation in slavery wealth and a quantitative spatial model. To measure wealth from slaveholding, we use a unique data source: Britain, through the Abolition of Slavery Act in 1833, provided compensation payments to existing slaveholders.
These compensation payments were substantial, equal to £20mn in historical prices, equivalent to around 40 per cent of the government’s budget and 5 per cent of gross domestic product (GDP). In today’s money, this corresponds to £2bn if adjusted for inflation, or £107bn if calculated as the same share of GDP. We use individual-level data on these compensation payments to more than 25,000 slaveholders, as compiled by historians over more than a decade in the Legacies of British Slavery database (Hall et al, 2014). This allows us to measure slavery wealth directly for each slaveholder – in terms of the total number of enslaved persons and their assessed value – and to locate these slaveholders geographically. We combine this measure of slaveholder wealth drawn from claims for compensation with detailed information on population, employment structure and property values.
Figure 1: Slaveholding and structural transformation in the 1830s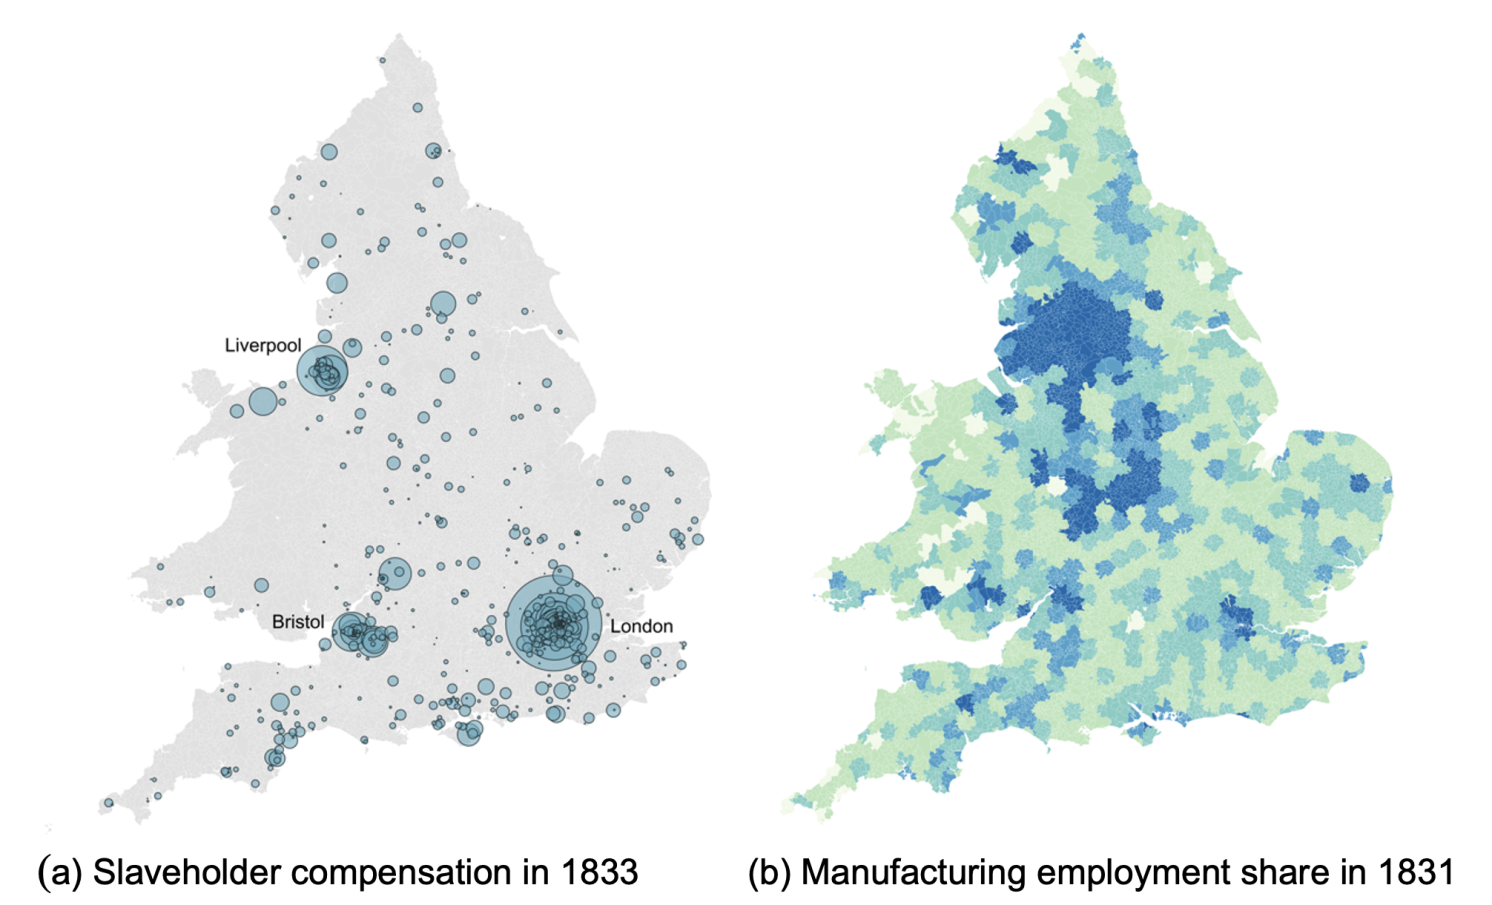
Notes: Left panel: Slaveholder compensation in each parish in 1833 pounds sterling; size of blue circles proportional to the total value of slaveholder compensation in each region. The largest three slave trading ports by enslaved persons embarked are labelled. Right panel: Manufacturing employment share in each region in the 1831 census; darker blue colours correspond to higher values; lighter green colours correspond to lower values.
Slavery wealth accelerated Britain’s industrial revolution
Across Britain, industrial activity and slavery wealth at the time of abolition are strongly correlated. Figure 1(a) displays slavery compensation claims across parishes in Britain. The size of the blue circles is proportional to the amount of slavery compensation awarded in current price 1833 pounds sterling. We find the largest concentrations in the areas surrounding the three ports most heavily involved in the slave trade and the products of the slave economy (particularly sugar, tobacco, coffee and cotton): Liverpool in the north-west; Bristol in the south-west; and London in the south-east. But slaveholding extended throughout much of England and Wales, particularly in coastal regions, and in the main population centres.
Figure 1(b) shows the manufacturing employment share across parishes in 1831. By that time, the manufacturing employment share for England and Wales as a whole was approximately 42 per cent, and we see the emergence of industrial agglomerations in the north. But agriculture still employs approximately 27 per cent of the population, and there is substantial heterogeneity in agricultural specialisation across regions, with agriculture still accounting for more than 60 per cent of employment in some counties. Comparing the two figures, there is a clear positive correlation between manufacturing employment shares and slaveholder compensation.
Figure 2: Structural transformation and slaveholding in the 1830s
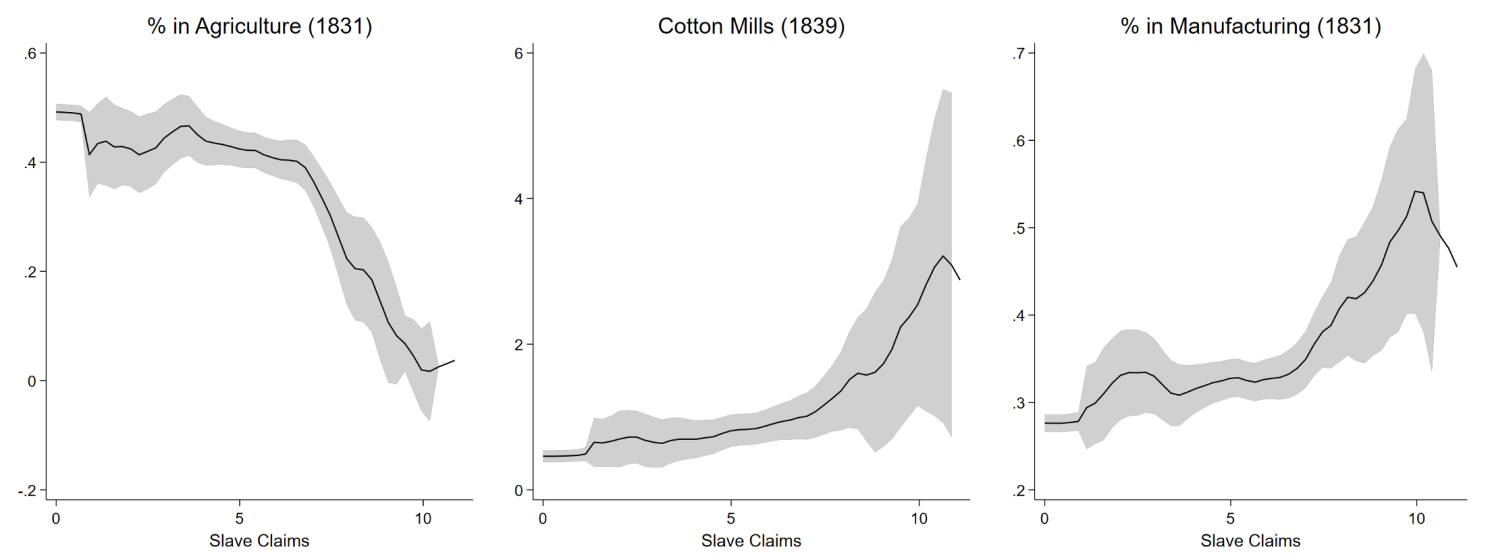
Notes: In all three panels, the horizontal axis shows total number of enslaved people in each hexagon in 1833; vertical axes show agricultural employment share in 1831 (left panel), number of cotton mills in 1839 (middle panel), and manufacturing employment share in 1831 (right panel); dark line shows fitted values from local polynomial regression; grey shading shows 95 per cent confidence intervals. Slave claims and the number of cotton mills are inverse hyperbolic sine transformed.
Figure 2 provides further evidence for the correlation between structural transformation and slaveholding using three different indicators: the agricultural employment share in 1831 (left panel); the number of cotton mills in 1839 (middle panel); and the manufacturing employment share in 1831 (right panel). We find that areas with extensive slaveholding have lower agricultural employment shares, more cotton mills, and higher manufacturing employment shares. Many slave traders eventually became slaveholders, investing their wealth in West Indian plantations. We make use of this fact to provide evidence that the correlation between economic activity and slaveholding is causal. Our analysis starts with the fact that in the age of sail, the idiosyncrasies of wind and weather heavily influenced the duration of transatlantic voyages. Crowded and inhumane conditions on slave voyages led to high rates of mortality during the Middle Passage.
Slavery wealth reshaped the geography of economic activity in Britain
A primary determinant of mortality for enslaved people was voyage duration. As voyage times increased because of unfavourable winds, water began to run out, and infectious diseases spread, raising mortality among the enslaved. High mortality reduced slave traders’ profits, making their continued involvement in the trade less likely. Hence, inclement weather shocks directly reduced wealth, and also induced exit from the slave trade, thereby reducing slaveholder wealth in 1833 (at the time of abolition). We track down the location of slave traders’ ancestors. Many traders, once rich, returned to their ancestral family homes. In places with more exposure to the slave trade through “family trees”, we typically find greater slave wealth in 1833. The effect is large: for every one standard deviation increase in the voyage success of slave traders emanating from a location (as measured by the share of enslaved people who survived the trans-Atlantic voyage), we find a 0.16 standard deviation rise in slaveholder wealth in that location.
Changing industrial activity
A range of measures of industrial activity are strongly related to this exogenous component of slaveholder wealth. A one standard deviation increase in slaveholder wealth predicted by our instrument leads to a 1.76 standard deviation increase in steam engines, a 0.52 standard deviation increase in rateable values, a 0.61 standard deviation decrease in agricultural employment contrasted by a 0.86 standard deviation increase in manufacturing employment, and a 0.77 standard deviation decrease in the average distance to the 10 nearest cotton mills in 1839.
To assess the implications of these findings, we combine these empirical estimates with a model of the spatial distribution of economic activity across industries and locations in Britain. Greater slavery wealth alleviates collateral constraints and stimulates domestic capital accumulation, which in turn induces an expansion in the capital-intensive domestic manufacturing sector, and a decline in the land-intensive agricultural sector. We use the model to undertake a counterfactual, in which we assume that Britain was not involved in slavery. Some locations benefited enormously from Britain’s involvement in slavery.
Comparing actual economic outcomes in 1833 with those in this counterfactual, places with the highest levels of slavery wealth saw increases in total income of more than 40 per cent, with population increasing by 6.5 per cent, capitalists’ income rising by more than 100 per cent, and landlords’ incomes declining by just over 7 per cent. At the aggregate level, we find an increase in national income of 3.5 per cent. This is sizeable relative to conventional estimates of the gains from international trade, where Bernhofen and Brown (2005) find an upper bound of 9 per cent for 19th century Japan.
It also corresponds to roughly a decade of growth of GDP per capita at the time. Capital owners were the largest beneficiaries, with an increase in their aggregate income of 11 per cent due to the direct income from investments in colonial plantations and the induced expansion in domestic investments. Landowners experienced small aggregate income losses of just under 1 per cent, because of the reallocation of labour away from agriculture. Expected worker welfare rose by 3 per cent, because of the substantial wage increases in slaveholding locations, and the reallocation of economic activity towards those locations.
Places with the highest levels of slavery wealth saw increases in total income of more than 40 per cent relative to a counterfactual in which Britain was not involved in slavery
Taken together, our findings suggest two important conclusions. First, involvement in the slave trade and wealth derived from slaveholding had an important effect on the geography of economic development during the British industrial revolution. While the sudden re-ordering of economic prominence in the period after 1750 has long seemed puzzling (Crafts, 2014), our evidence offers a clear explanation for why some locations suddenly took off economically. Second, our results strongly suggest that Marx was right: slavery wealth accelerated Britain’s industrial revolution.
This article summarises “Slavery and the British Industrial Revolution” by Stephan Heblich, Stephen Redding and Hans-Joachim Voth, CEP Discussion Paper No. 1884. A version of it first appeared as the CEPR/VoxEU column “Slavery and the British Industrial Revolution.”
All articles posted on this blog give the views of the author(s), and not the position of LSE British Politics and Policy, nor of the London School of Economics and Political Science.
Featured image: Textile manufacture/power loom weaving in a Lancashire mill, 1834. The image is in the public domain.