 Looking at the relationship between the UK’s public debt levels and economic growth using data from 1831 to 2013, Costas Milas finds that public debt has been a drag on the UK economy in the last few years. This justifies the government’s decision to put in order its finances. Equally important, the time to resume interest rate hikes is when economic growth hits 3%.
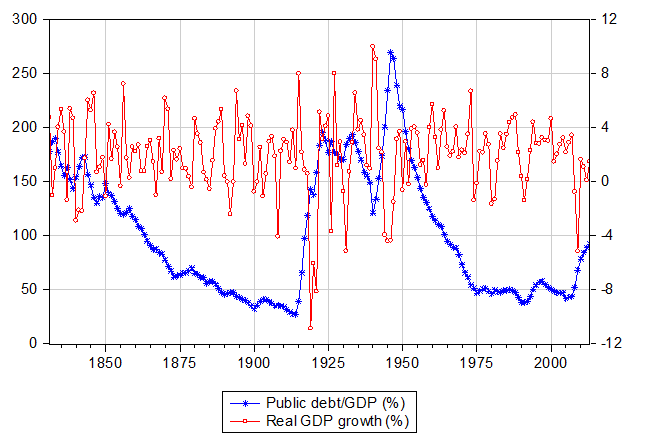
It has definitely been the economic talk of the year: How big was the error in the excel file of Professor Carmen Reinhart and Professor Kenneth Rogoff and what was (if any) its impact on the relationship between public debt and GDP growth? In this piece, I will take a different view. Rather than “agonising” on a public debt-to-GDP ratio above which the debt burden “kills” GDP growth, I will look at the impact (if any) of the debt burden on UK growth in periods of high as opposed to normal (and/or low) growth. This is an important debate because the current economic policy has been criticised on the grounds that it attempts to cut the deficit too fast at a time when the economy is not entirely back on its feet. To shed light on this, I start by plotting (in Figure 1) UK’s public debt (gross government debt) and UK’s real GDP growth over the 1831-2013 period (annual data).
Figure 1: UK public debt/GDP (%; Left Hand Side axis) and UK real GDP growth (%; Right Hand Side axis), 1831-2013
Data sources: International Monetary Fund (IMF) historical database, Bank of England three centuries of data and website of Professor Carmen Reinhart
Based on this historical dataset, median GDP growth is equal to 2.24% whereas median public debt/GDP equals 84.6%. Hence, a (predicted) GDP growth of 1.5% for 2013 is (somewhat) below the historical median whereas a current public debt/GDP of (around) 90% (based on estimates from the International Monetary Fund) is slightly above the historical median. The two variables have a mild negative correlation (equal to -0.11). However, a negative correlation does not establish causality. To identify any effect from debt/GDP on real growth I will treat both variables as endogenous within a Vector Autoregressive (VAR) model which controls for the endogenous effects of CPI inflation and the policy interest rate (as a proxy for UK’s cost of borrowing). My model distinguishes between a “high” and a “normal” (or lower) growth regime. Both regimes are endogenously determined by the data (we, econometricians, call this a regime switching Threshold VAR model). I “run” the model using the 1831-2013 dataset and observe how positive shocks to public debt impact on GDP growth. The main results are summarised as follows:
- The model results (entirely driven by the data) distinguish between (i) a high GDP growth regime (equal to 2.98% per annum or higher) and (ii) a normal (or lower) growth regime (when annual real GDP growth drops below 2.98%). I note that since 1831, UK growth of 2.98% (or higher) has been recorded in 67 out of 183 years (37% of the time).
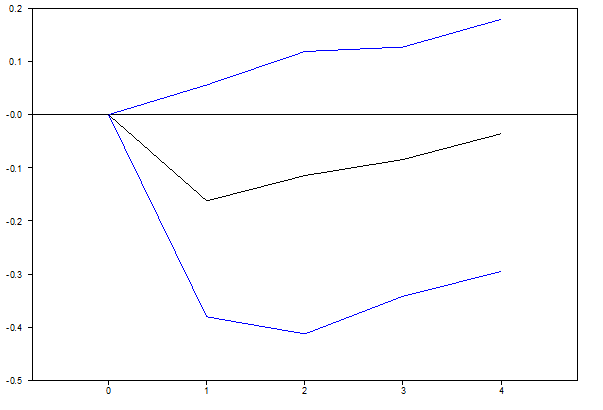
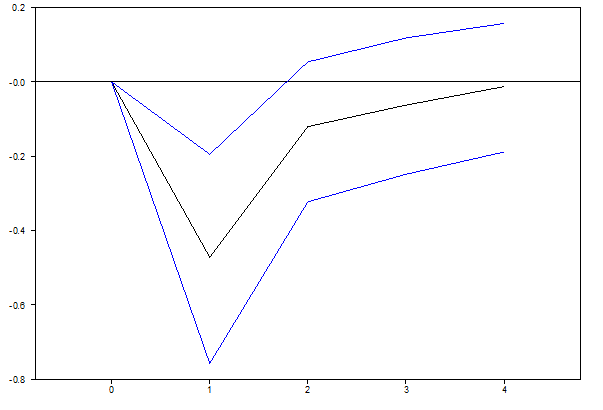
- In the high growth regime, a positive public debt shock has a negative impact on UK growth within a 4-year horizon. Figure 2 plots the median response of real GDP growth to a public debt/GDP (equal to one standard deviation) shock when the economy is “booming”. Although the impact is negative, it remains statistically insignificant (the 1-standard deviation error band includes zero). Hence, the debt burden exists but it is not statistically significant when the economy is firmly on its feet (Note to readers: action is taken in period 0 (now) and we look at its impact within a 4-year horizon).
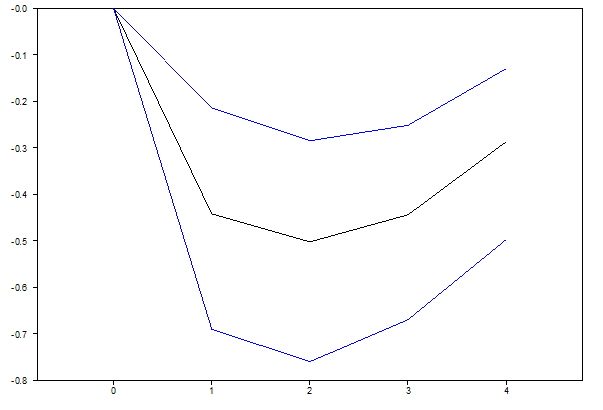
- In the low growth regime (Figure 3), however, shocks to public finances have a negative impact on UK growth within a 4-year horizon which are statistically significant. In other words, public debt does drag UK real growth down within a 4-year horizon (and the economy is far from booming). This suggests to me that the government’s agenda to deal with the rising public finance burden in the current economic environment of low growth is indeed justified.
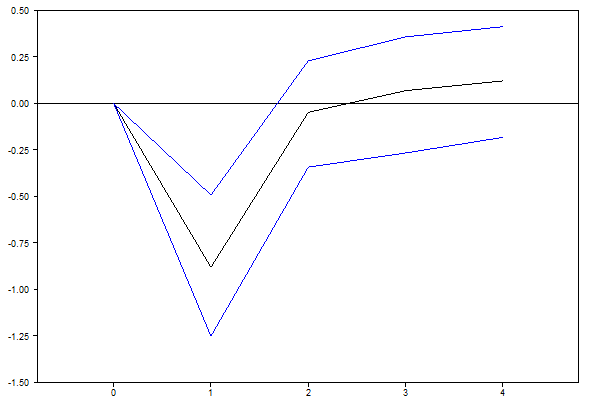
Equally, important, this methodology allows me to examine the economic implications of a tighter monetary policy. From Figure 4 and Figure 5 below, one observes that the negative impact of an increase in the UK’s policy interest rate on UK’s real GDP growth turns out to be larger when the economy crosses the 2.98% growth boundary. In its latest Inflation Report, the Bank of England predicts growth to approach 3% in 2014. Hence, to minimize the negative economic impact of an interest rate hike, it seems to me Mark Carney and his Monetary Policy Committee colleagues need to resume interest rate action next year.
Figure 2: Response of GDP growth (Left Hand Side Axis) to DEBT/GDP shock within a 4-year horizon (Horizontal axis). High growth regime
Figure 3: Response of GDP growth (Left Hand Side Axis) to DEBT/GDP shock within a 4-year horizon (Horizontal axis). Normal (and/or low) growth regime.
Figure 4: Response of GDP growth (Left Hand Side Axis) to policy interest rate (R) shock within a 4-year horizon (Horizontal axis). High growth regime
Figure 5: Response of GDP growth (Left Hand Side Axis) to policy interest rate (R) shock within a 4-year horizon (Horizontal axis). Normal (and/or low) growth regime.
Note: This article gives the views of the author, and not the position of the British Politics and Policy blog, nor of the London School of Economics. Please read our comments policy before posting.
About the Author
Costas Milas is Professor of Finance at the University of Liverpool Management School. Email: costas.milas@liverpool.ac.uk




Can we get some more details on the specifications of this regime switching VAR model? As the article is drafted, there is nothing in there about how the author dealt with the fact that the debt/gdp series is clearly non-stationary, while the gdp growth series looks stationary. If the series were just put into a regression model (of any kind) without adjustment, then the result is clearly GIGO, but if the debt/gdp series was differenced, then a lot of long run information would have been thrown away (and the statements about the relationship between the level of debt/GDP and subsequent growth would be pretty hard to interpret).
Also, the impulse response of the VAR seems like a very poor way to assess causality in the model. Impulse responses aren’t measures of marginal effect – they just aren’t. And reasoning from an impulse shock to the public debt stock to draw conclusions about “the government’s policy” is clearly flawed. The initial effect of the government’s policy decision was an increase in government debt relative to baseline, not a decrease, and the policy was justified on the basis of long-term sustainability, not the immediate response of GDP growth one year afterward.
Presumably this article summarises some larger piece of research in which these points are addressed?