In their recent briefing paper on breaks and discontinuities in official data series in the UK, Ruth Dixon and Christopher Hood highlighted the tension between the demand for quantitative evidence to drive performance improvement and the tendency to systematically destroy the very evidence by which performance can be evaluated. This paper was discussed, and further examples of data breaks across the public sector were explored, at a seminar at LSE in April 2015 attended by senior civil servants and academics. An ensuing discussion embodied the same tensions, with some participants emphasising the need for indicator continuity, and others stressing that indicators must change as methodologies, purposes, and audiences evolve. Can this tension be resolved? In this article, Ruth Dixon, Tony Travers and Christopher Hood suggest that recommendations arising from the seminar might point to a way to reconcile these demands.
Continuity versus Responsiveness
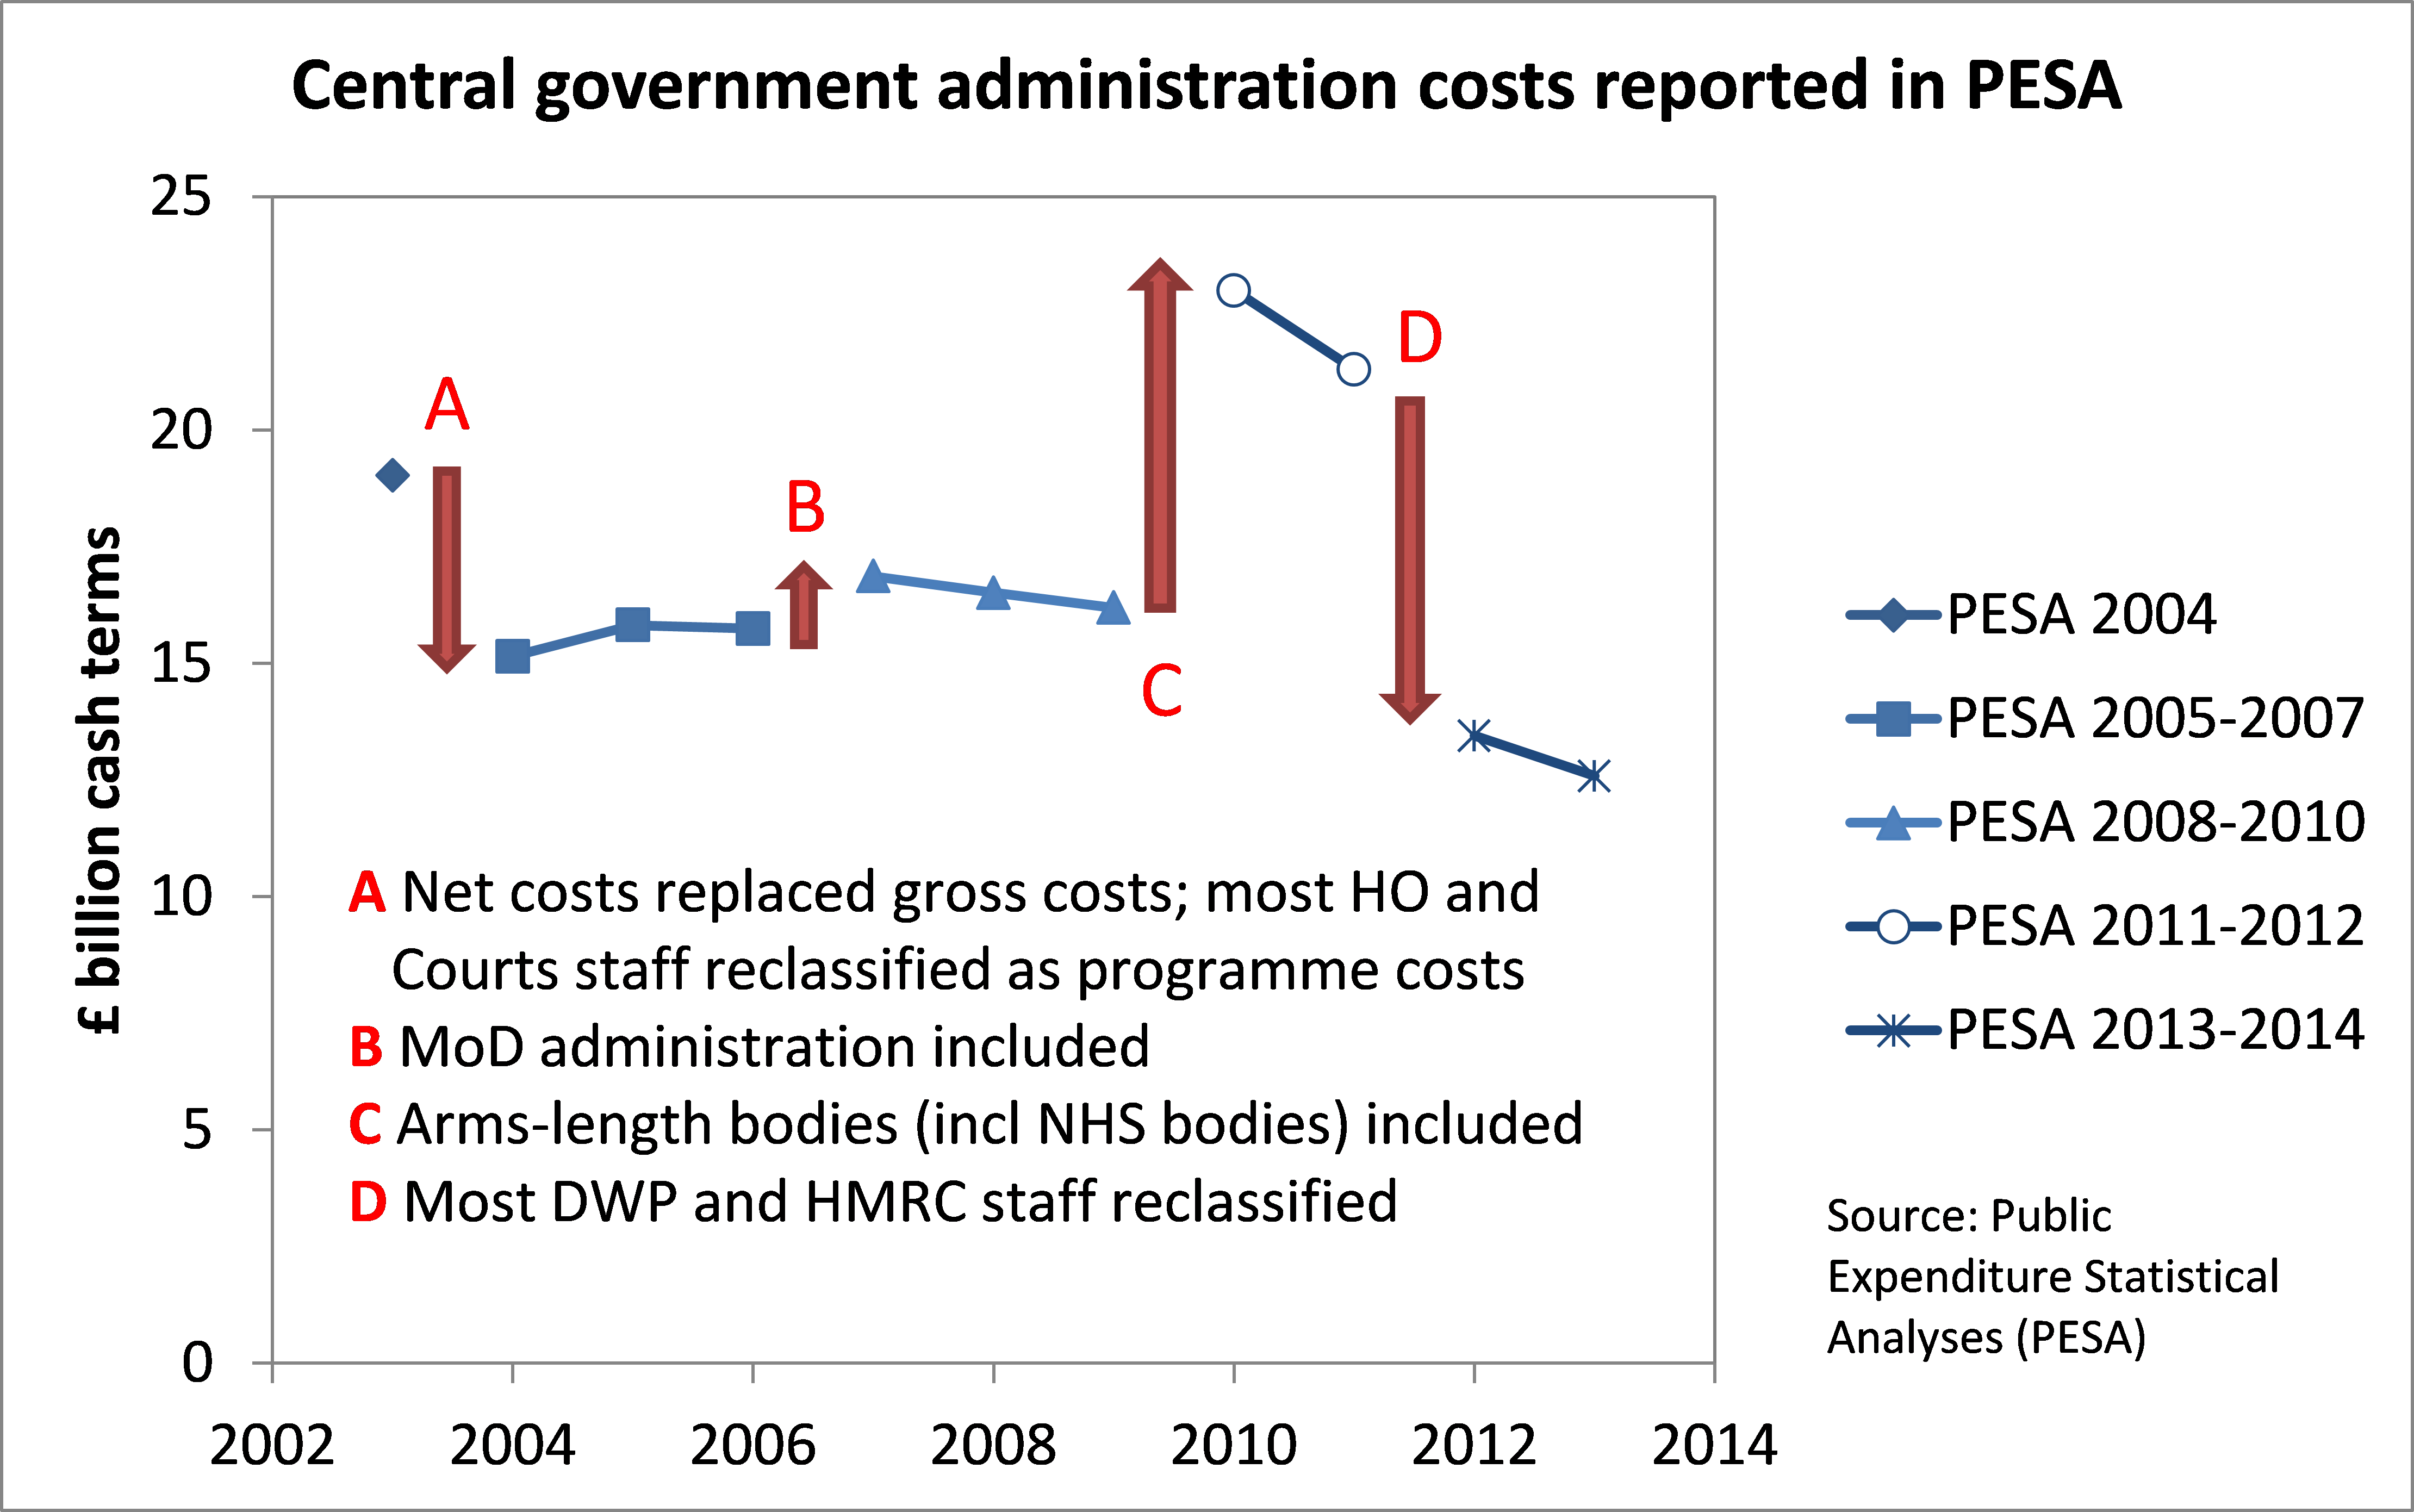
At the LSE, most of the panellists argued that a degree of indicator continuity is essential to measure government performance or to track headline public spending numbers. Tony Travers showed examples of how (apparently) final ‘outturn’ public spending data in the official Public Expenditure Statistical Analyses (PESA) are altered in subsequent years. Ruth Dixon showed how the definition of central government administration costs in PESA changed so much over the 2000s that no meaningful comparison can be made over that period (see Figure 1). Nor did EU or OECD data series seem to be any more stable or long-lasting than national datasets.
Figure 1: Breaks and Discontinuities in Reported Government Administration Costs
Alexander Jan (from Ove Arup, a consultancy) described how when Arup was commissioned by the Office of Rail Regulation to review the costs and efficiency of Network Rail, they found that the calculations changed radically at each reporting round. In some cases the data supplied were arguably not suitable for some of the purposes for which they were intended. Alex quoted Roger Ford, editor of Modern Railways, ‘this is the fourth year in a row that Arup has provided a qualified opinion for regulatory financial statements. Well, if Arup can’t work out what’s going on after four attempts, what hope for the rest of us?’ As Alex noted, the remuneration of some senior managers was linked to these indicators. Ideally, they need to be readily understood by those holding the organization to account such as ministers, non-executive directors and regulators.
Several participants noted that there is little incentive for rigorous data archiving, continuity or ‘ownership’ of data series in government. Some of the audience agreed that policymakers need to know whether a time-series used to inform public policy decisions ‘really is a series’ in any meaningful sense.
Other participants questioned the value of stability in every data series, arguing that many retrospective comparisons are of limited value. A former government accountant pointed out that financial reporting methods continue to mature, and the best (or newest) systems should not be rejected simply to ensure continuity. For instance, UK government moved from cash-based to resource-based accounting in the 2000s, and latterly moved to whole-of-government accounts. Others pointed out that the value of any indicator as an instrument of control over public bodies depends on its being changed to counter gaming and reflect current concerns. Indicator change may also reflect major changes in policy, as when the definitions of employment and benefit changed with the introduction of Universal Credit.
It is undeniable that indicators that never change become subject to gaming, cause output distortions, or simply cease to reflect the concept that they were originally designed to measure. But the question remains whether current practice represents the optimal balance between continuity and change. If the main official national records that purport to offer an authoritative picture of the state of the public finances (for instance, PESA and the Local Government Financial Statistics) cannot even be compared from year to year by experts, where should we turn?
The data series in which we found serious discontinuities or complete breaks are not trivial or obscure, but are (or should be) of major importance to the evaluation of government of any political stripe, such as total public sector capital investment, local government spending (on which the Office for Budget Responsibility and the government differ whether it is rising or falling), how much the government costs to run, and how much the civil service costs to employ. It is possible to provide long-running, consistent official series. For instance, civil service staff numbers have been reported in Civil Service Statistics since it was first published in 1970. And consistent records of tax revenues have been included in the annual budget reports (the Treasury’s Red Book) for many decades.
Overlapping Series Provide Transparency
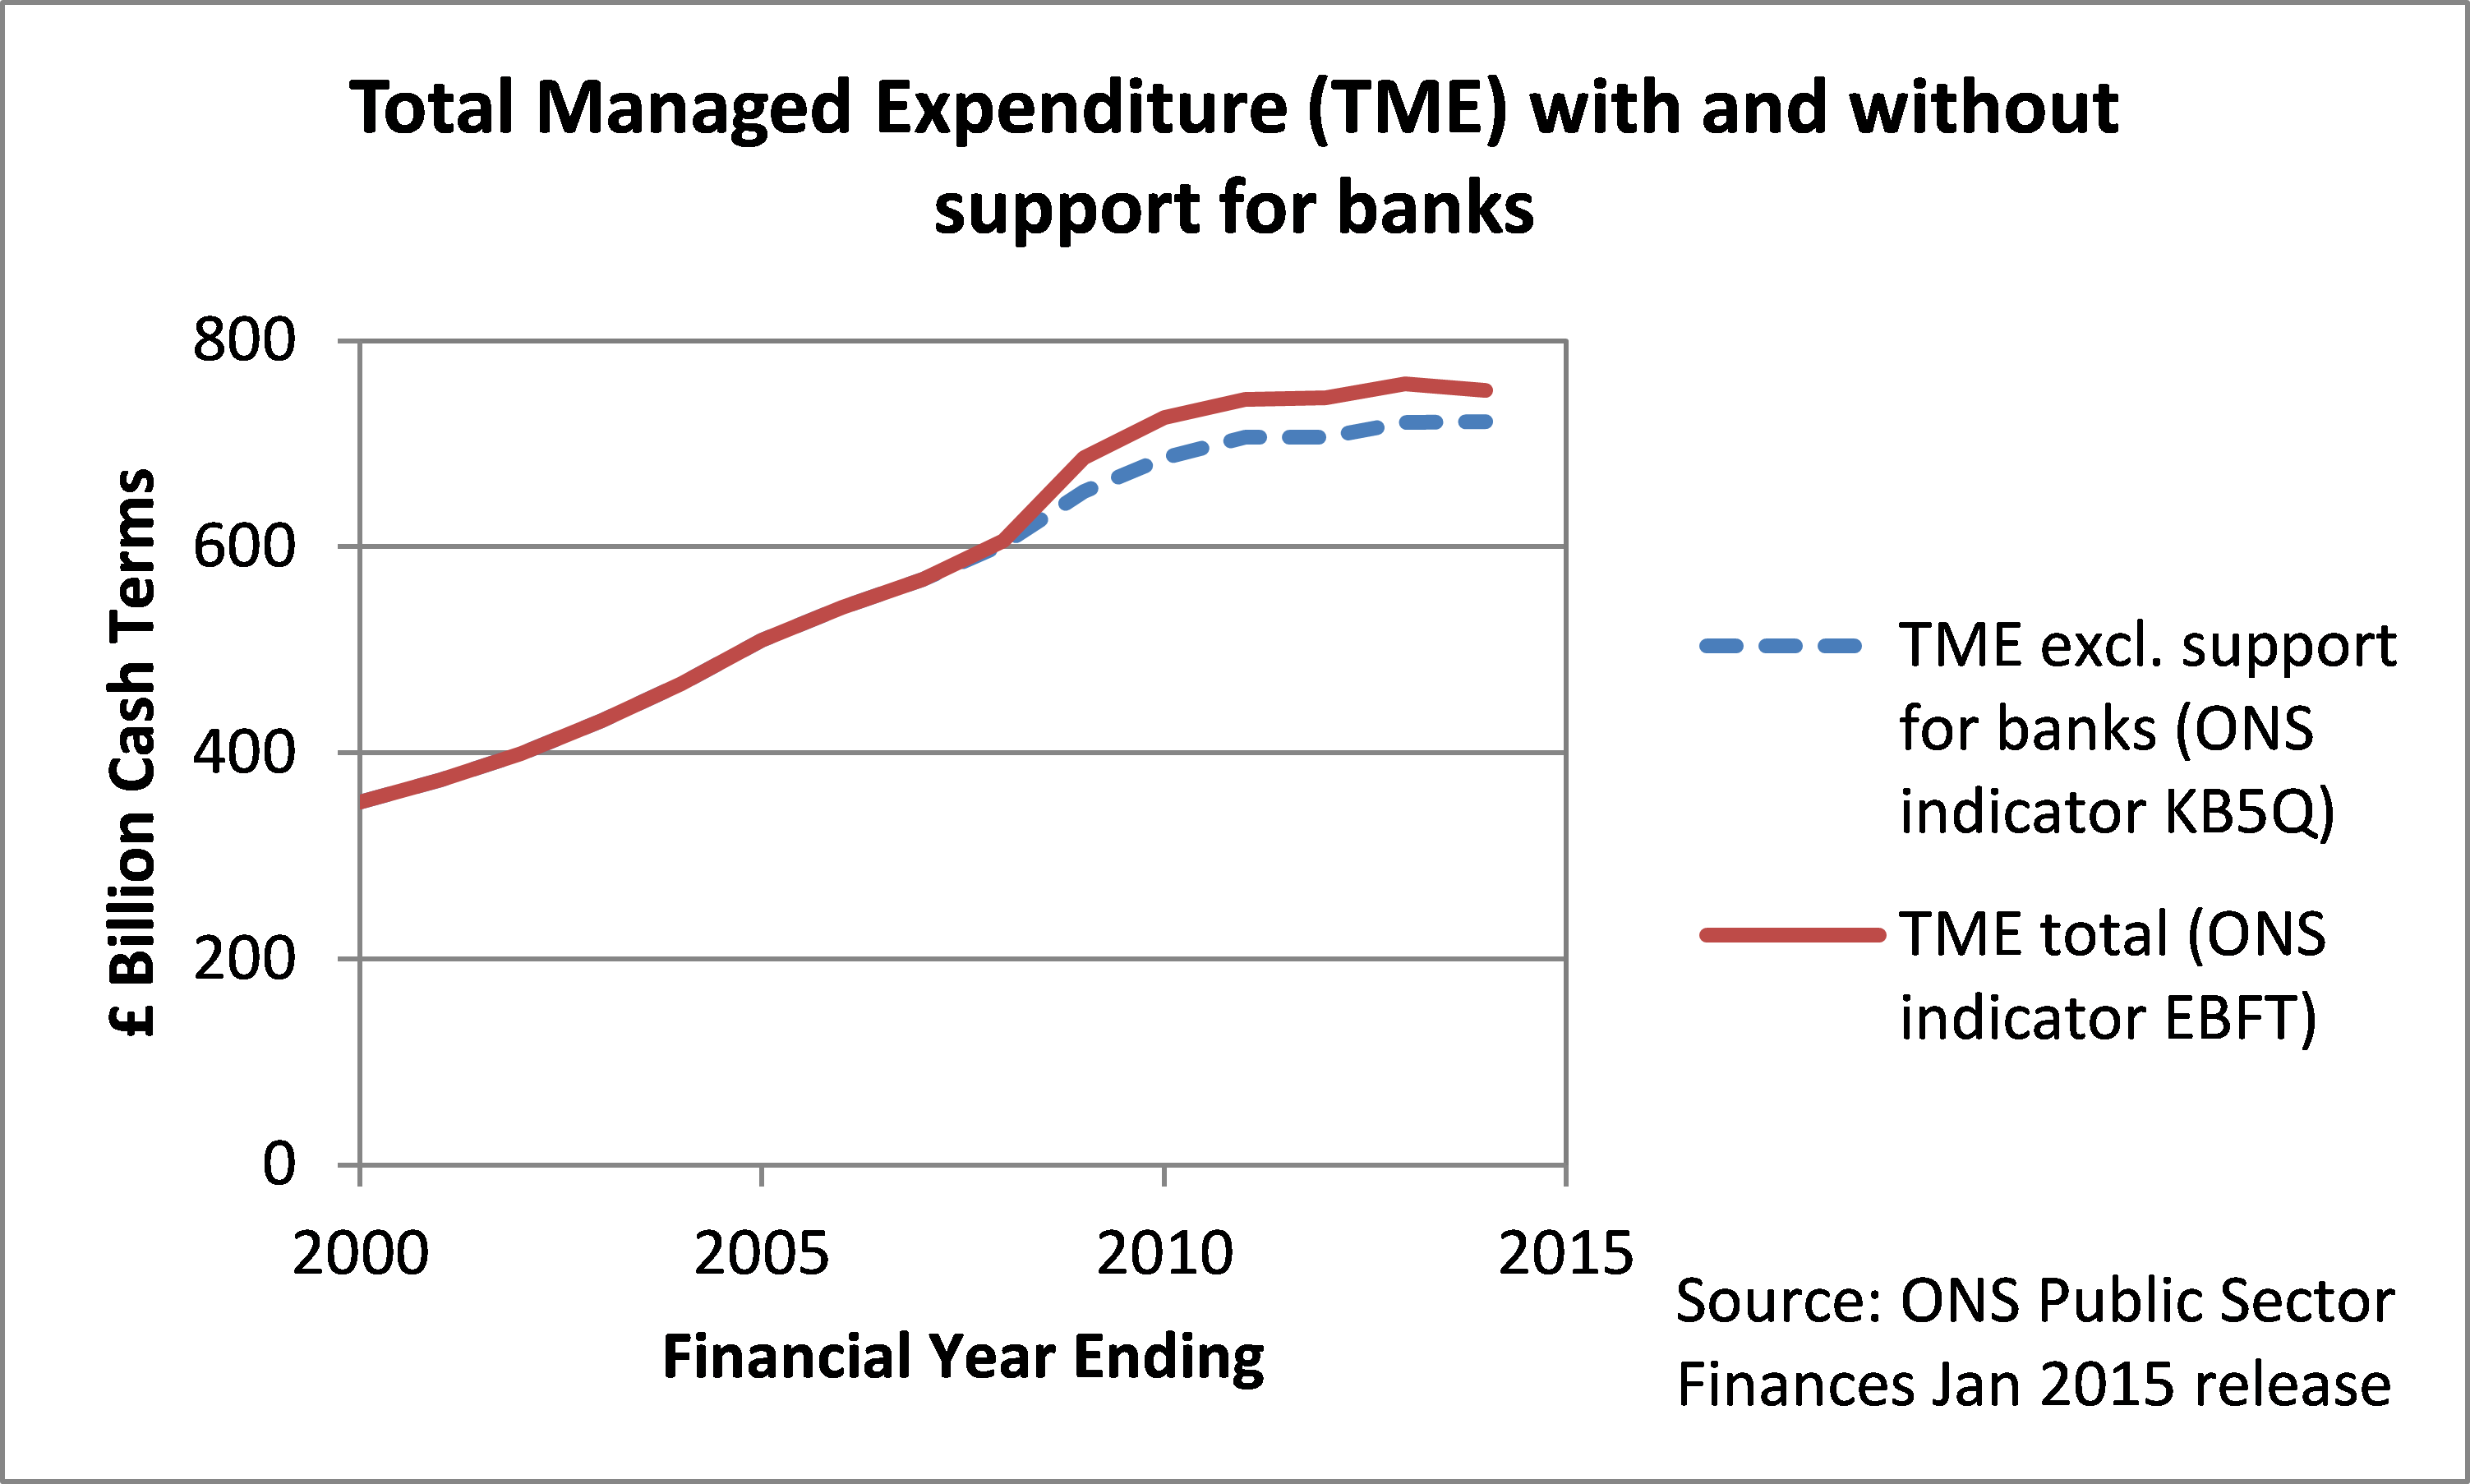
In our [Dixon and Hood] briefing paper, we suggested that overlapped stepped series offer a possible reconciliation between continuity and responsiveness. By this, they meant that when indicators change their definition or methodology, the effects of the change must be shown by calculating the metric in the old and new ways for several overlapping years. If transparently reported, this method allows us to identify significant changes and understand the consequentiality of those changes. That technique was used by the Office for National Statistics (ONS) to show Total Managed Expenditure with and without the support given to banks after the financial crisis in 2007 as shown in Figure 2.
Figure 2: Example of Good Practice: Transparently Showing Effect of Classification Change
Some participants argued that this requirement is simply too onerous—unavoidable changes are too frequent and complex for the tension between continuity and change to be reconciled in this way—and that officials are required to report the situation ‘as it is now’. Policymakers, they said, are not interested in some hypothetical ‘might have been’. But we argue that if that is the case for indicators on which public policy depends, the data should not be presented as a time-series at all.
As Iain McLean demonstrated in his presentation, sometimes the data turns out to be so corrupt that there is no remedy other than ‘breaking’ the time-series and starting again, as he and his colleagues found when they looked into EU regional spending figures reported in PESA in the mid-2000s. In that case, they had to inform the Treasury that the data prior to 2004 was ‘irretrievable.’
Our Recommendations
In summary, we find ample evidence that breaks and discontinuities are so ubiquitous in official data sets that tracking government performance over time is severely compromised. Of course there is no easy solution for reconciling the need for continuity with the demand to update and modernize indicators. Nevertheless, we suggest that at least for key or leading official statistics such as those summarizing the state of the public finances, public organizations should (i) consider carefully whether the ‘pros’ of updating an indicator outweigh the ‘cons’ caused by the discontinuity; (ii) carefully report, explain, and justify each change in methodology or definition, properly archiving such documentation; and (iii) demonstrate the consequentiality of each change by means of overlapping stepped series. Oversight bodies such as parliamentary select committees and audit bodies should press for such practices to be followed, in consultation with professional authorities such as the Royal Statistical Society and the Chartered Institute for Public Finance and Accountancy.
Note: This article gives the views of the authors, and not the position of the British Politics and Policy blog, nor of the London School of Economics. Please read our comments policy before posting.
Ruth Dixon is a Leverhulme Trust Postdoctoral Researcher at Oxford.
Christopher Hood is the Gladstone Professor of Government and Fellow at All Souls College.
Tony Travers is Director of LSE London, a research centre at the London School of Economics. He is also a Visiting Professor in the LSE’s Government Department.