 How do British MEPs fare in the European Parliament? In a previous article Simon Hix demonstrated that British MEPs are less likely to be on the ‘winning side’ in European Parliament votes than MEPs from any other state. Here, he breaks down the success by policy area, noting that British MEPs do reasonably well in some policy areas UK voters care about, such as internal market regulation, international trade, and international development, but are most marginalised on budget issues.
In a recent post I analysed the success and failure of UK MEPs, in terms of how often they are on the ‘winning side’ in votes in the European Parliament. The main finding was that British MEPs are less likely to be on the winning side than the MEPs from any other member state. The main reason is that voting in the European Parliament is dominated by the three main political groups – the centre-right European People’s Party (EPP), Socialist and Democrats (S&D), and Alliance of Liberals and Democrats for Europe (ALDE) – and the representation of British MEPs in these groups has declined, as a result of the departure of the British Conservatives from the EPP and fewer British MEPs in ALDE and the S&D.
One question this raised, though, was whether there was any variance by policy area, as British voters care more about some EU issues than others – such as single market regulation (which includes financial services), justice and home affairs (which includes the free movement of people), and the EU budget. To answer this question I have analysed the votes in 2009-14 by policy area. The results are as follows.
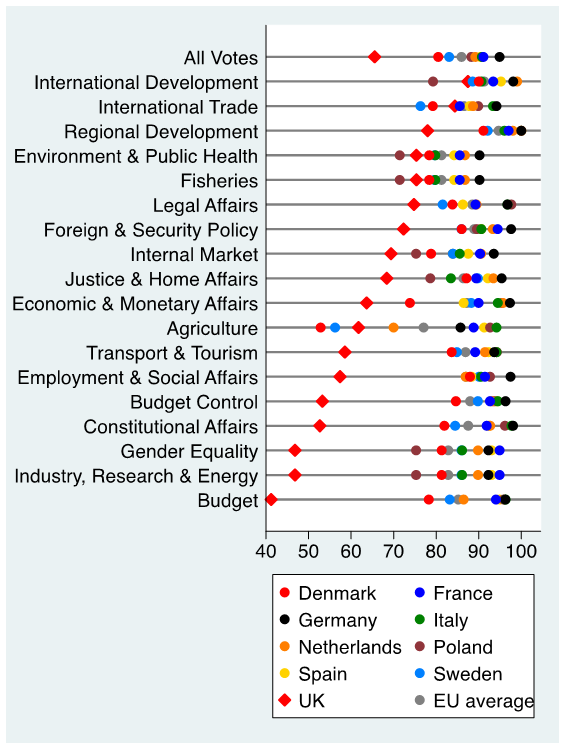
Figure 1: Percentage of times a member state’s MEPs were on the winning side in votes in the European Parliament (2009-14)

Note: A member state’s delegation of MEPs was calculated as being on the ‘winning side’ in a vote if the plurality of the MEPs from the member state voted the same way as the majority of all MEPs in the vote. Only policy areas for which there were at least 100 votes are considered. Source: VoteWatch.eu
Figure 1 compares the ‘winning rates’ by policy area of the MEPs from the 6 biggest member states plus the UK’s main EU allies (Netherlands, Sweden, and Denmark). As the top line shows, UK MEPs were on average (in all votes) least likely to be on the winning side: UK MEPs were on the winning side in 66 per cent of votes compared to an average of 86 per cent. But, UK MEPs were more successful than some other national delegations on International Development, International Trade, Environment and Public Health, and Agriculture.
Also, British MEPs were more likely to be on the winning side in some policy areas than other, namely International Development, International Trade, Regional Development, Environment and Public Health, Fisheries, Legal Affairs, Foreign and Security Policy, Internal Market, and Justice and Home Affairs. Notably, these cover many of the key issues for the UK. Worryingly, though, British MEPs were least likely to be on the winning side on Budget Issues. The contrast between the British MEPs and the French and German MEPs is also striking, as German MEPs are the most successful MEPs in almost all areas, and French MEPs are not far behind. Interestingly, despite being from a smaller member state, the Dutch MEPs are almost as successful as the Germans.
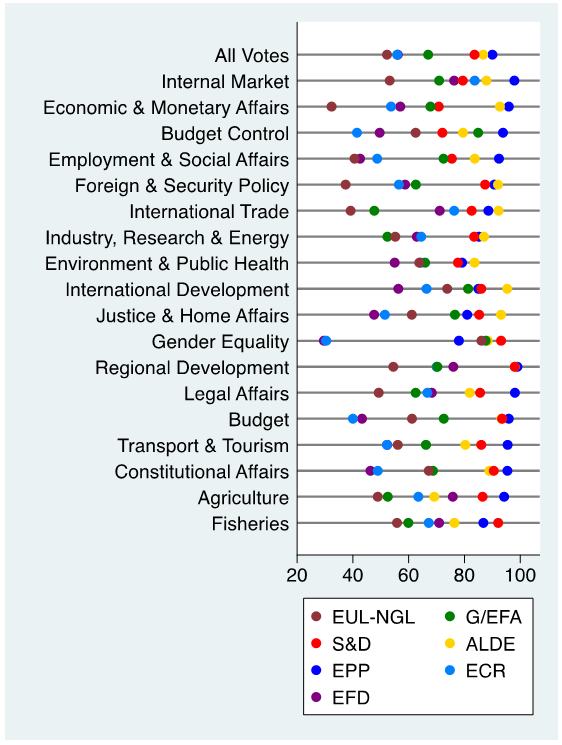
Figure 2: Percentage of times a European political group was on the winning side in votes in the European Parliament (2009-14)

Note: A political group was calculated as being on the ‘winning side’ in a vote if the plurality of the MEPs from the group voted the same way as the majority of all MEPs in the vote. EUL-NGL = European United Left/Nordic Green Left, G/EFA = Greens/European Free Alliance, S&D = Socialists and Democrats, ALDE = Alliance of Liberals and Democrats for Europe, EPP = European People’s Party, ECR = European Conservatives and Reformists, EFD = Europe of Freedom and Democracy. Only policy areas for which there were at least 100 votes are considered. Source: VoteWatch.eu
What these patterns hide, though, is that voting in the European Parliament is mainly along political group lines rather than national lines. As a result, the national membership of the groups together with the success rates of the groups by policy area ultimately determines the ‘winning rates’ of a member state’s MEPs. Figure 2 hence shows how frequently each political group was on the winning side in each policy area in 2009-14.
The policy areas are grouped in the figure by the type of coalition that forms. The first 8 areas (from Internal Market down to Environment and Public Health) are dominated by a centre-right coalition, where EPP and ALDE MEPs often vote together against S&D MEPs, and as a result are more successful than S&D MEPs on these issues. The next 3 areas (International Development, Justice and Home Affairs, and Gender Equality) are dominated by a centre-left coalition, where S&D and ALDE MEPs often vote together against EPP MEPs, and as a result S&D and ALDE MEPs are more likely to be on the winning side than EPP MEPs. Finally, the last 7 issues (from Regional Development to Fisheries) are dominated by a ‘grand coalition’, where EPP and S&D MEPs often vote together against the smaller groups.
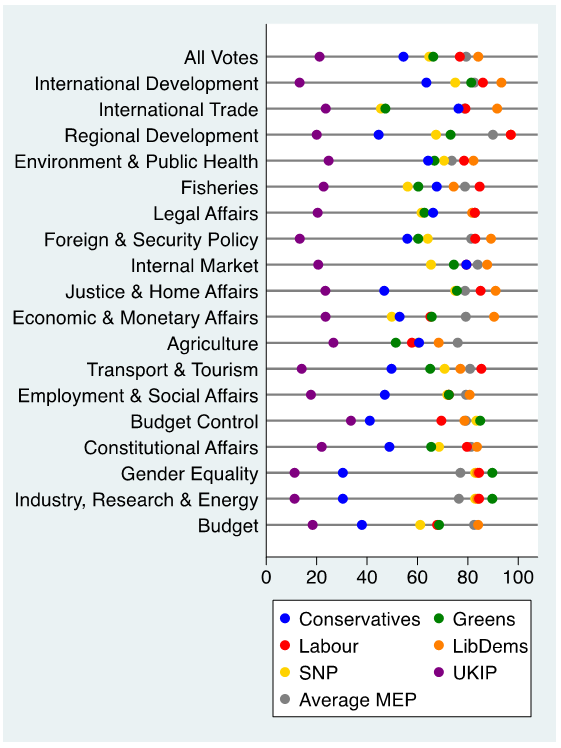
Figure 3: Percentage of times a UK party’s MEPs were on the winning side in votes in the European Parliament (2009-14)

Note: A UK party was calculated as being on the ‘winning side’ in a vote if the plurality of the MEPs from the party voted the same way as the majority of all MEPs in the vote. The parties are coloured according to their political group membership. Only policy areas for which there were at least 100 votes are considered. Source: VoteWatch.eu
British Labour MEPs sit in the S&D, whilst the Liberal Democrats sit in ALDE. However, no British MEPs sit in the EPP. British Conservatives sit in the European Conservatives and Reformists (ECR) group, UKIP sit in the Europe of Freedom and Democracy (EFD) group, and the Greens, SNP and Plaid Cymru sit in the Greens/European Free Alliance (G/EFA). As Figure 2 shows, EFD were the least successful group in many areas. However, ECR were on the winning side almost as often as the EPP on Internal Market and International Trade.
This combination of UK party membership of the groups, and the pattern of success rates of the groups, means that the British parties were more successful in some policy areas than others, as Figure 3 shows – sorted by the average success rate of UK MEPs (most successful at the top). The overall winning rates of the S&D and ALDE means that Labour and the Lib Dems are more likely to be on the winning side than the Conservatives, UKIP, SNP, and the Greens.
Nevertheless, Conservative MEPs are on the winning side almost as often as Labour and the Lib Dems on Internal Market and International Trade issues. Meanwhile, the Greens are most successful on Budget Control, Gender Equality, and Industry, Research and Energy, and the best issues for the SNP are these three issues plus Justice and Home Affairs, and International Development. Perhaps not surprisingly given their general opposition to the EU, UKIP MEPs are on the winning side least in all areas.
Overall, these results confirm the fact that British MEPs are marginalised on many policy issues in the European Parliament. This is largely a result of the British Conservatives leaving the dominant EPP group, as well as the increase in the number of UKIP MEPs (who are almost always on the losing side) relative to Lib Dem and Labour MEPs (who are most often on the winning side).
Nevertheless, there is some variance by policy area. British MEPs do reasonably well in some policy areas British voters care about, such as internal market regulation, international trade, and international development. Worryingly, though, British MEPs seem most marginalised on budgetary issues.
However, roll-call votes do not tell the full story of power and influence inside the European Parliament. As a result, in my next post I will look at British MEPs’ access to the key positions of power, such as committee chairs or rapporteurships.
___
Note: This article was first published on our sister site, EUROPP – European Politics and Policy.
 Simon Hix is Harold Laski Professor of Political Science at the London School of Economics and Political Science and Senior Fellow on the ESRC’s UK in a Changing Europe programme.
Featured image credit: EU Exposed CC BY


1 Comments