In the wake of changes to voting rules, Katy Morris looks at data which could indicate areas where significant numbers of voters may be disenfranchised at future elections, with important ramifications for democratic participation in the UK.
We are just weeks away from the first mainland British elections in which voters will be required to show photo ID in order to vote, a requirement controversially introduced by the Elections Act 2022. On 4 May 2023, when a total of 8,057 council seats are up for grabs across swathes of England, voters will have to show poll workers one of an approved list of photo IDs in order to obtain a ballot paper.
Though the estimated 2 million voters who do not already possess one of the approved forms of photo ID can apply for a Voter Authority Certificate online or by post, take-up has been extremely low. This reflects very low awareness of the new requirement: the arrival of poll cards highlighting the need for photo ID has triggered public surprise and dismay.
As a country without mandatory ID cards and relatively expensive passports, possession of photo ID in the United Kingdom is uneven across demographic groups and between places. Where are problems most likely to arise next month and in future general elections?
An uneven picture
Newly released ONS Census 2021 data offer important insight into probable photo ID black spots in England and Wales. The two maps below show the parliamentary constituencies with the highest proportions of individuals with no passport and households without a car – households in which individuals are presumably less likely to have driving licences. Passports and driving licences are the most common forms of photo ID in the UK.
In the map below, we see that the proportion of individuals without passports varies substantially within England and Wales. While very high proportions of London and South East residents have passports, rates are much lower in coastal areas, particularly in the East Midlands, Eastern England, the South West and Wales.
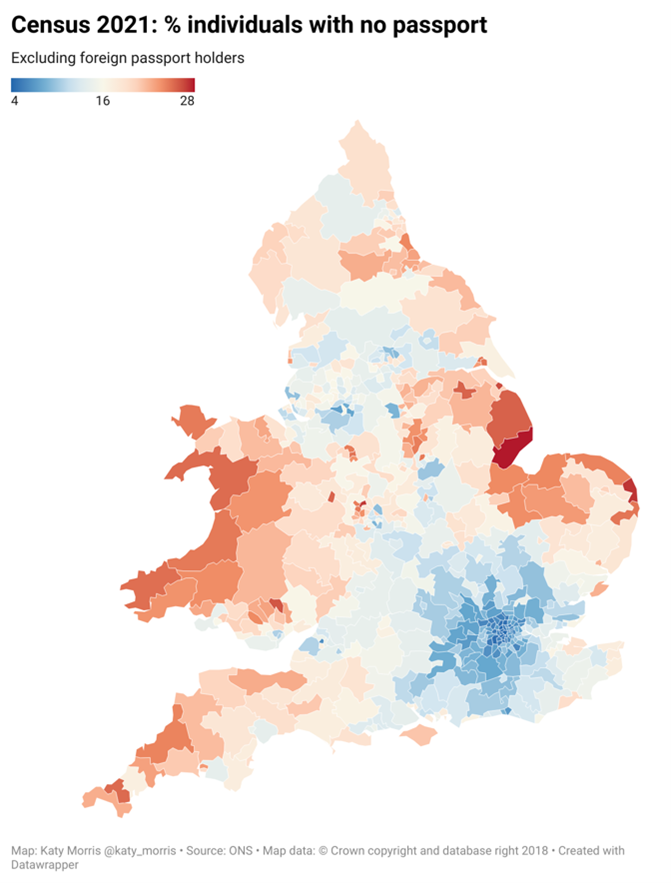
Indeed, more than a quarter of the (presumed) British residents of the Scunthorpe, Boston & Skegness, Great Yarmouth, Great Grimsby and Louth & Horncastle constituencies in the East of England do not have passports. The same is true for Telford and Walsall North in the West Midlands, Camborne & Redruth in Cornwall, and Blaenau Gwent, Dwyfor Meirionnydd and Preseli Pembrokeshire in Wales.
In the map below, we see that the proportion of households with no car also varies a great deal. But this is undoubtedly a worse indicator of whether or not people are likely to have photo ID; plenty of people have driving licences but not cars, and others with cars may have paper driving licences (plastic licences were only introduced in 1999) that won’t suffice as voter ID.
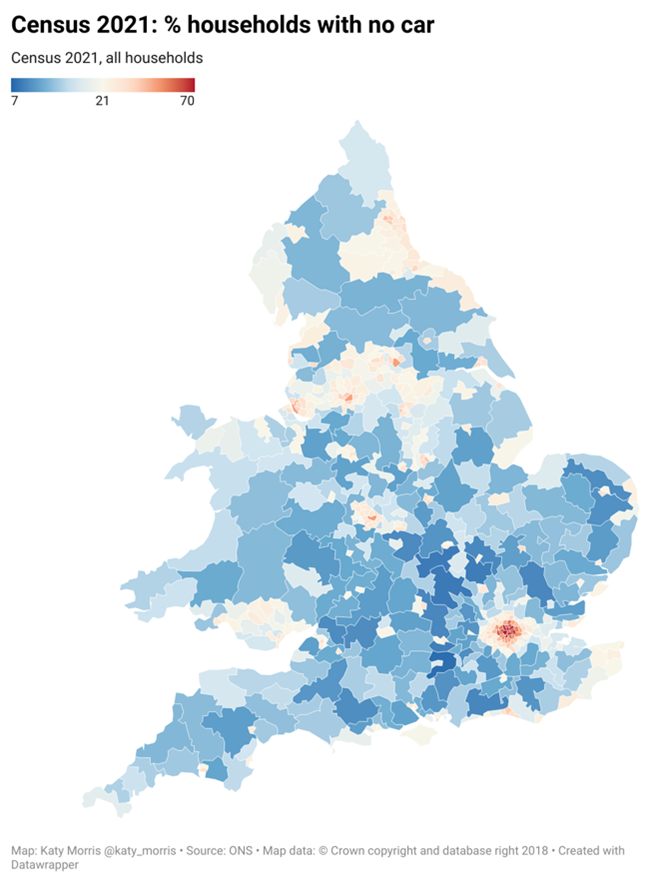
As a general rule, the two do not map onto each other very well for the reasons you might expect: young urban graduates in London, Birmingham, Leeds and Manchester are very likely to have passports, but are increasingly less likely to own cars. But as the third map below shows, there are important exceptions in orange and red: places with high proportions of individuals with no passport and households with no car.
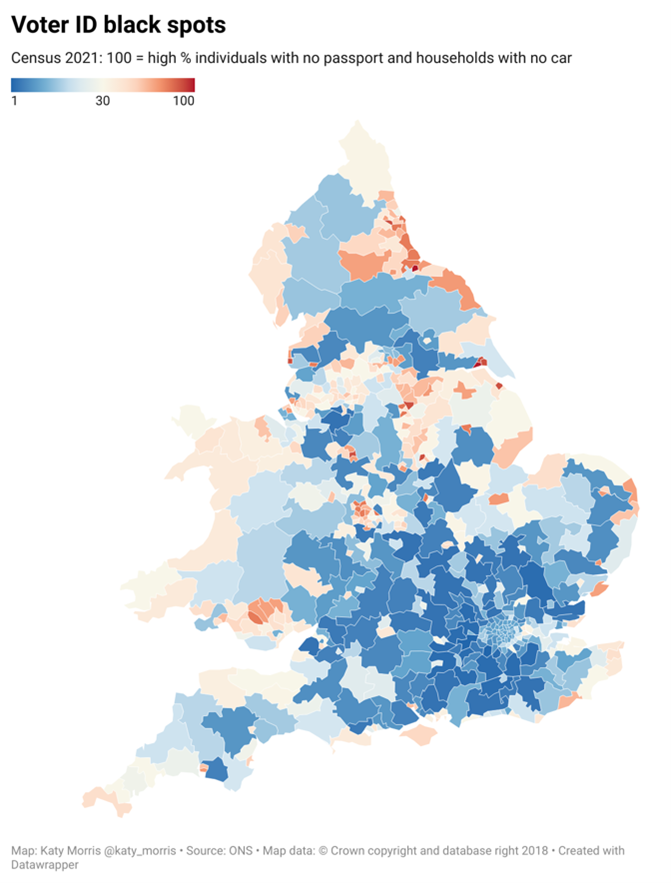
The scale on this map varies from 1 to 100, where 100 means a constituency is in the top decile in terms of both the proportion of individuals with no passport and the proportion of households without a car. On this basis, Middlesbrough and Kingston upon Hull West & Hessle are the most likely photo ID black spots, with Great Grimsby, Stoke-on-Trent Central, Kingston upon Hull East, Kingston upon Hull North, Nottingham North, Blackpool South, Rotherham and Gateshead very close behind. Other clusters of constituencies in the North East, Yorkshire, the West Midlands and South Wales also stand out as potential photo ID black spots.
Time is running out
There are many caveats with this kind of analysis. Firstly, photo ID is not necessary if voting by post, and postal voting rates also vary considerably. Secondly, the list of accepted photo ID includes many forms of ID that were not counted in the 2021 Census. As highlighted above, there is also the option to apply for a Voter Authority Certificate, though only 2 per cent of those believed to lack photo ID had applied for one by 1 April 2023.
Most importantly, such area-level data cannot tell us what proportion of individuals do not possess a passport or a driving licence; they can only indicate where it is most likely that people do not have one of the two most common forms of accepted voter ID. But it’s worth pointing out that nobody knows the true figure, including the government that passed the 2022 Elections Act.
Amid concerns about unrest at polling stations on 4 May, where should efforts to raise awareness of the new photo ID requirement and ensure that people who want to vote are able to do so be concentrated? As the clock ticks down until the postal vote application deadline on 18 April and the Voter Authority Certificate deadline on 25 April, the answer is clear: everywhere, but especially the probable photo ID black spots.
All articles posted on this blog give the views of the author(s), and not the position of LSE British Politics and Policy, nor of the London School of Economics and Political Science.
Image credit: photo by Catholic Church of England and Wales, Attribution-NonCommercial-NoDerivs 2.0 Generic (CC BY-NC-ND 2.0)