Youth custody has severe long-term consequences for detained young people. Stephen Machin, Sandra McNally and Jenifer Ruiz-Valenzuela investigate the relationship between GCSE qualifications and youth custody, and find that underlying problems become evident in early adolescence.
A very small number of young people, about four in 1,000 boys, enter youth custody between the ages of 16 and 18, yet the consequences are severe. They spend an average of seven months in youth custody and such incarceration has been related to negative outcomes in the longer term. Apart from being a very negative outcome for young people themselves, this is expensive for the public purse. It would be in the private and social interest to prevent individuals from having to enter in the first place.
Previous research has shown a causal relationship between educational achievement and the probability of youth crime (Lochner 2011; Draca and Machin, 2015). We evaluate whether there is a relationship between GCSE qualifications in English and maths and the probability of youth custody. We are hindered in this because the majority of young people who end up in youth custody are either not entered or fail their GCSEs in these subjects.
Unsurprisingly, but empirically validated here with administrative data, the correlation between GCSE grades and the probability of ending up in youth custody is driven by variation at the lower end of the distribution (when other factors are accounted for).
Understanding who is in youth custody
We use data from the National Pupil Database linked to the National Client Caseload Information System (NCCIS) for those who did their GCSE exams in the academic years 2011/12 to 2013/14.
We link this with AQA exam board data on marks for GCSE English, GCSE English Language and GCSE maths (available in 2013/14 only).
First, we explore descriptive statistics of the sample, understanding how those who enter youth custody differ from the general student population in their observable characteristics. As the vast majority of those in youth custody are boys (94 per cent), our analysis is for boys only. Only a very small proportion of students end up in youth custody at the age of 16 or 17 – about four in 1,000. We look at whether they were in education, employment, training as well as not in education, employment or training (NEET) or in other activities before and after entering youth custody. For many this is not known, but where this is known, there is no indication of better outcomes after a spell in youth custody relative to before in terms of education, training or employment (to the extent that there is much difference). The biggest known category is NEET. Roughly, 35 per cent of the sample are categorised as NEET before a spell of youth custody and 36 per cent after.
Educational qualifications
We are interested in whether qualifications at age 16 affect the probability of entering youth custody. Many of those entering youth custody do not even have an entry for GCSE English or maths, as shown in Figures 1 and 2 below.
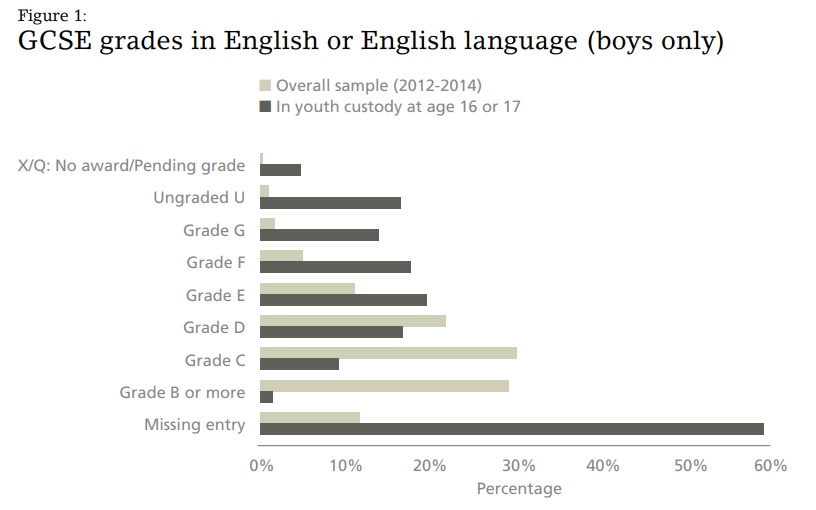
the fraction of students falling into each qualification grade for GCSE English/GCSE English
Language. Note that a further 15% of those in youth custody have other types of English entry.
This still leaves 45% with no entry at all.
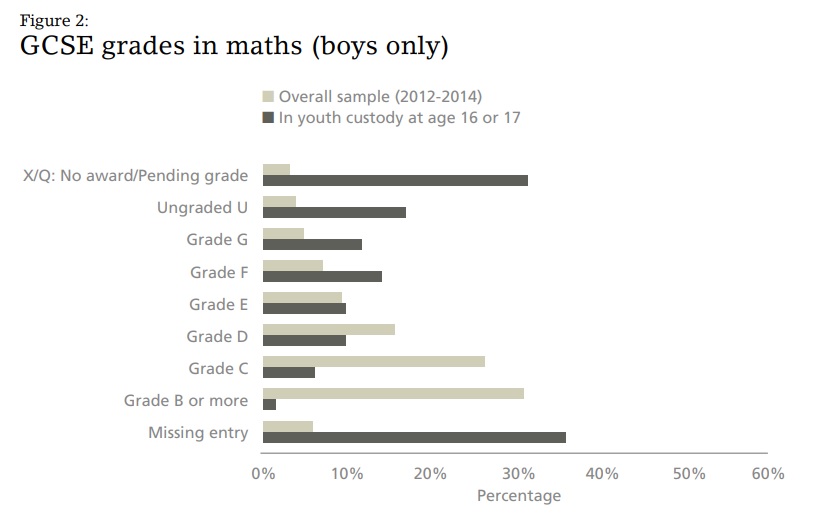
the fraction of students falling into each qualification grade for GCSE mathematics. Note
that a further 5% of those in youth custody have other types of maths entry. This still leaves
30% with no entry.
Around 60 per cent of those who subsequently enter youth custody have a missing entry for GCSE English. While 15 per cent have been entered for other types of English qualification, 45 per cent have not been entered at all. And this no-entry number is 30 per cent for maths. Where there is an entry, those who enter youth custody at age 16 or 17 are very likely to have received very low grades relative to other boys attending state schools. If we sum those who either have a missing entry (including non-GCSE subjects), no award or a fail in GCSEs, this comes to 66 per cent for English and 78 per cent for maths.
There is a correlation between entry to and grades in GCSE English and maths and the probability of ending up in youth custody at age 16 or 17. But, as so many people destined for youth custody are concentrated at the bottom of the distribution or not entered at all, there are limits to what we can say about the effect of improving skills at age 16 on the probability of entering youth custody. It is very likely that the reasons why people enter youth custody are similar to the reasons why they are not even entered for exams (or fail the exams) and that the correlation between these two things represents the influence of these other factors. In a quantitative study relying on administrative data alone, we cannot say much about what these other factors might be. Nonetheless there are some interesting insights coming from some simple descriptive analysis.
Personal characteristics
There are very striking differences between the personal characteristics of boys in youth custody at age 16 or 17 compared with the rest of the male population who were in Year 11 at the same time. Those who enter youth custody are much more likely to have been eligible to receive free school meals when at school (40 per cent relative to 15 per cent in the rest of the sample). Although like the rest of the population, they are more likely to be White British than any other ethnicity, they are much more likely to be Black African or Black Caribbean compared with the rest of the sample (6 per cent and 5 per cent of those observed in youth custody at ages 16-17, respectively, are Black African or Black Caribbean relative to 2.8 per cent and 1.4 per cent among other boys). They are less likely to speak English as a first language – though the differences with the rest of the sample are not as striking. And they are much more likely to be classified as either having a statement of special educational needs (SEN) or having “School Action Plus” as a SEN category. There is much less difference in the more basic “School Action” SEN category.
Taken as a whole, 75 per cent of those boys ending up in youth custody at age 16 or 17 were designated under a special needs category while at school (usually a more serious one) whereas this is only 25 per cent among other boys (of which about half received the more serious designation of School Action Plus or a statement). This strong correlation between SEN and the probability of ending up in youth custody is also reflected in the institution attended when in secondary school. Figure 3 below shows the school type attended by boys who subsequently went into youth custody compared with all other boys attending state schools in Year 11. It shows that a high percentage of boys who subsequently went into youth custody attended either pupil referral units (26 per cent), community special schools (11.6 per cent), alternative provision (9 per cent) or secure units (3.4 per cent) compared with a very small proportion attending these school types in the rest of the sample (4 per cent for all these types of institution collectively).
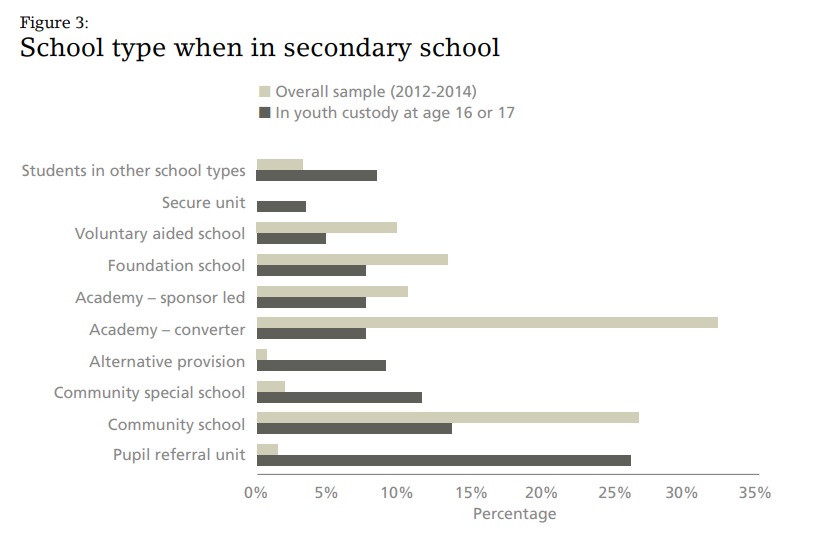
fraction of students falling in each category (school type) as described by the vertical axis.
It seems likely that the type of complex needs causing students to enrol in such institutions or receive a serious type of SEN designation are also behind non-entry or very poor grades at GCSE and the eventual outcome of youth custody at age 16 or 17. Of course, there are many more students classified as SEN or in a special type of institution than those who end up in youth custody. The percentages might lead one to believe that there is hardly anyone in, for example, secure units, who does not subsequently end up in youth custody. But this is deceptive as the number of those not in youth custody is such a big number (888,774). Numerically, about 38 per cent of boys attending secure units end up in youth custody and hence, most do not. Thus, even though the correlations are high, there is no simple, mechanical relationship.
Educational attainment in primary school
Attainment in primary school at age 11 in English and maths tests (at key stage 2) was already very much worse for those entering youth custody later. But although there is a negative correlation between achievement at age 11 and ending up in youth custody, about half of such boys had met the government’s expected level in English or maths at that time, many of whom did very badly in exams at age 16 (if they were entered at all). This suggests that for many, problems either emerge or become evident in early or middle adolescence.
The association between grades at GCSE and youth custody
Our analysis shows that most of the correlation between specific grades and the probability of entering youth custody is driven by variation at the bottom of the distribution, from grade F or lower (or non-entry). This is unsurprising given the descriptive statistics discussed above. When full controls are added, there is no association between getting either grade D or E (relative to a grade C) and the probability of later entering youth custody. But there is an association at levels below that, even with controls.
The association between GCSE grades and the probability of entering youth custody is consistent with educational achievement having a role to play in influencing this outcome. But the analysis mainly serves to highlight that there are likely to be common unobserved factors influencing both non-entry/failing GCSEs and entering youth custody. It is certainly plausible that enabling people to achieve a better education would help to keep them out of youth custody – though the analysis suggests it might be very challenging to do so given the significant vulnerabilities faced by this group of young people and which is reflected in their characteristics.
Given the large number of boys in youth custody with either a serious special needs designation when at school and/or being in a special type of educational institution for their secondary education, a useful direction for future research would be to investigate the efficacy of the types of intervention that occur within these settings.
This article first appeared in CentrePiece, the magazine of the Centre for Economic Performance. It summarises the paper “School Qualifications and Youth Custody” by Stephen Machin, Sandra McNally and Jenifer Ruiz-Valenzuela, CEP Occasional Paper No. 57. This paper forms part of a larger project funded by the Nuffield Foundation: “Youth Custody: Educational Influences and Labour Market Consequences”.
All articles posted on this blog give the views of the author(s), and not the position of LSE British Politics and Policy, nor of the London School of Economics and Political Science.
Image credit: Photo by Felicia Buitenwerf via Unsplash.