 No matter people’s major mode of transportation, they are almost certain to be a pedestrian at some stage of the journey. Having better information in busy urban areas, such as countdowns at intersections, can help to make being a pedestrian safer. Using Toronto as a case study, Sacha Kapoor and Arvind Magesan investigate the effects of introducing pedestrian countdowns on pedestrian and automobile safety. They find that while countdowns do make pedestrians safer, they also can lead to an increase in automobile accidents, as they facilitate more aggressive driving. They argue that in these sorts of contexts, full transparency of local information may not necessarily lead to the best outcomes for all.
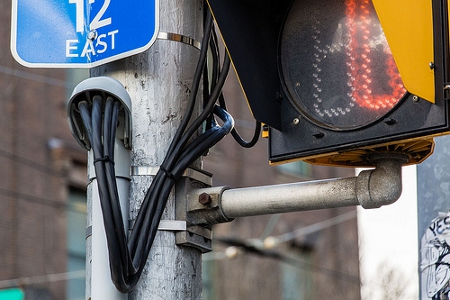
Pedestrian Countdown Signals have spread to cities across the globe, from New York and London to Mexico City and New Delhi, and from Oakland and Oxford to the smaller cities of Asia and Africa. The signals are visible countdowns that display the time until a traffic light changes from green to yellow, and their purpose is to make life safer for people travelling by foot along our roads. Apparently, having better information about the time until the next light change improves your chances of crossing the street in one piece.
Whereas the intent is to inform pedestrians, in many cities the countdowns are visible to all visitors of an intersection. This includes drivers who can, for example, use the countdown to adjust the speed at which they approach. If drivers tend to use countdowns to “beat the light” then intersections can, in fact, become more dangerous for everyone. This very real possibility means that cities, when considering pedestrian countdown signals for their streets, might do well by first taking into account the implications of the signals for the safety of road users overall.

In a recent study we used data from the City of Toronto to consider these issues. We investigated whether advertised countdowns improve the safety of pedestrians, whether they facilitate aggression on the part of drivers, and the overall implications for the safety of all road users. We found that while countdowns do reduce the number of pedestrians hit by cars, they actually increase the number of traffic collisions.
Toronto provides a near ideal context for assessing the impact of pedestrian countdown signals. Other studies that analyze the impact of countdowns use data from contexts where countdowns are installed at select intersections. To assess the impact of countdowns, the studies then either compare accidents at intersections with countdowns and intersections without or compare accidents at the same intersection before and after the installation. These sorts of comparisons across intersections are problematic because intersections can differ in many ways, such as foot or car traffic, and because city officials probably account for the differences when deciding where to install countdowns. In such instances it is difficult to separate the pure impact of countdowns from the influence of good (or bad) decision making by city officials.
Comparisons over time of the same intersection are problematic because of changes in road user behavior that arise naturally over time. If drivers are becoming more cautious, perhaps because of media blitzes concerning traffic safety, then this will result in fewer accidents. If this happens during the periods where countdowns are being installed, then changes in driver behavior can also confound the pure impact of countdowns.
Our context is nearly ideal because the City inadvertently set up, in effect, a randomized controlled trial. For one, the City did not place countdowns at select intersections. A countdown was pretty much installed at every intersection in the city. For two, the rollout of countdowns was gradual. From period to period we observe some intersections receiving countdowns and some not. This gradual rollout allows us to isolate the effects of countdowns from the effects of natural changes in driver behavior over time. For three, and perhaps most importantly, the order of installations was unrelated to patterns of accident histories across the intersections. Labour costs, above all else, determined where and when the installations were to take place. It is the negligible role of accident histories in installations decisions that makes random, in effect, the assignment of countdowns to intersections.
After analyzing the data generated by the City’s “experiment”, we found that countdowns do what they were intended to do. They reduced the number of pedestrians struck by automobiles. We also found, to our surprise, that they precipitated about a 5 percent increase in collisions between automobiles per month as well as more collisions overall. These findings alone suggest that cities can do better by informing pedestrians, and not drivers. This could be done, perhaps, by announcing the time remaining through a speaker that only pedestrians can hear.
Once we established the main results, we set forth to understand why countdowns might cause more collisions. One theory, as we already discussed, is that countdowns facilitate aggression on the part of drivers. Another is that countdowns are distracting to drivers. Drivers watch the countdowns instead of keeping their eyes on the drivers in front of (and behind) them.
The welcome thing about data from the city of Toronto is that it allows us to sort through the two theories. To do so we considered wide gamut of outcomes, such as the number of collisions that were rear ends, head on, involving a driver making a left turn, etc. We also considered the responses of drivers once they became familiar with the countdowns.
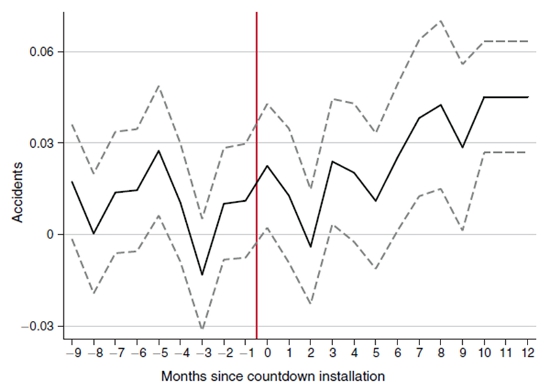
Our findings point to countdowns as facilitators of aggressive driving. In this regard two findings stand out. As Figure 1 illustrates, first, countdowns resulted in more rear ends. Second, the overall effect on collisions becomes stronger as time passes. Drivers who know the time that remains can more easily determine whether, by speeding up, they can make the light. When they do speed up, and the driver in front does not, the chances of a collision increase. While the first finding is also consistent with countdowns distracting drivers, the second finding is not. If countdowns are distracting then their effect should be largest right after the installations, before drivers familiarize themselves with the new signals. A large initial effect is the opposite of what we find.
Figure 1 – Pedestrian Countdown Signals and Their Effects on Collisions

Finally, we also considered the broader applicability of our findings, first for other cities and second for policymakers. In the study we determined that countdowns had the largest effects at intersections that were historically safe, and may in fact reduce collisions at the most dangerous intersections. The finding has two implications. First, cities may benefit from selectively placing countdowns at historically dangerous intersections but not at historically safe ones. Second, while city-wide countdown installations can improve safety in cities where accidents are commonplace, they may reduce safety in cities where accidents rarely happen.
The broader lesson is: full transparency is not always a good thing. The principles at play in our setting also apply to other settings. The principles explain why, for example, authorities do not cry fire or announce bomb threats publicly. Keeping the threats hidden from the public eye can, at least for a short while, serve rather than harm the public interest.
This article is based on the paper ‘Paging Inspector Sands: The Costs of Public Information’, in the American Economic Journal.
Please read our comments policy before commenting.
Note: This article gives the views of the authors, and not the position of USApp– American Politics and Policy, nor of the London School of Economics.
Shortened URL for this post: http://bit.ly/1pZtqeL
_________________________________
 Arvind Magesan – University of Calgary
Arvind Magesan is an Assistant Professor of Economics at the University of Calgary. His research interests include applied microeconomics, empirical industrial organization and political economy.
_
 Sacha Kapoor – Erasmus University Rotterdam
Sacha Kapoor is an Assistant Professor of Economics at the Erasmus University Rotterdam. His research interests include applied microeconomics, the economics of organizations, and labor economics.


