 As of 2010, over half of the U.S. foreign population was located in the suburbs, with just one third living in cities. But how has suburban segregation affected these immigrants? In new research which examines immigrant suburbanization patterns, Chad R. Farrell finds that many immigrants experience a great degree of segregation in the suburbs. Immigrants from Canada, Germany, and the UK experience the lowest levels of segregation, while Latin American and Caribbean immigrants experience the highest.
Suburbanization and immigration have combined in recent decades to dramatically transform the metropolitan United States. These demographic forces are nothing new, of course. American “streetcar suburbs” date back to the 1880s and a century ago the U.S. foreign-born population—hailing primarily from Europe—was larger in relative terms than it is today. Contrary to previous eras, however, a growing majority of Americans now live in the suburbs and the current immigration streams from Asia, Latin America, and the Caribbean dwarf those that had originated in Europe.
American suburbs are absorbing the bulk of these newcomers, as immigrants now often bypass large cities and settle directly in the metropolitan periphery. In 1980, roughly equal numbers of immigrants resided in the cities and suburbs. By 2010, over half of the U.S. foreign-born population was located in suburbs of large metropolitan areas and just one-third resided in cities. Immigration has contributed to increasing ethnoracial diversity in metropolitan America and to the emergence of ‘melting pot suburbs’ in the outskirts of cities like Houston, Las Vegas, San Francisco, and Washington, D.C. How are these immigrant suburbanites incorporated into the residential mix? Are suburbs becoming more residentially integrated or are they fragmenting into a checkerboard of segregated neighborhoods similar to that observed in many U.S. cities? These are important questions given that residential patterns are so intricately tied to immigrant incorporation into the social and economic fabric of American life. In recent research, we found that many immigrant groups experience a large degree of segregation in the suburbs, though others experience much lower rates.
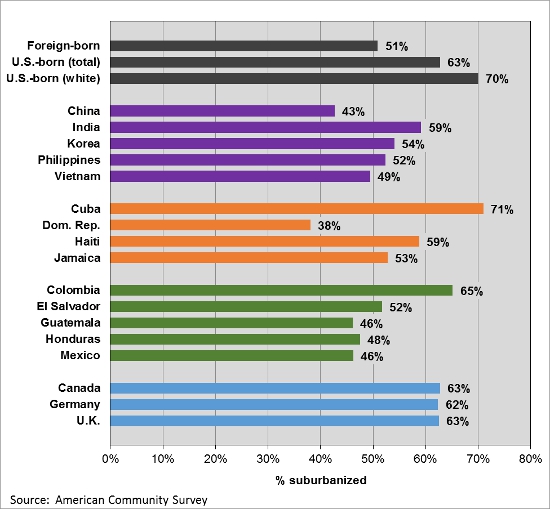
Data from the U.S. Census Bureau’s American Community Survey (ACS) can provide insights into immigrant suburbanization patterns. Figure 1 provides suburbanization rates for the 17 largest immigrant groups in the U.S. using 2008-2012 pooled ACS data. Suburbanization rates—defined here as the percentage of the metropolitan population residing outside the urban core—vary markedly by country of origin. Among Asian origin groups, Chinese immigrants continue to exhibit city-centric settlement patterns while most Indians have opted for the ‘burbs. Caribbean origins account for both the highest (Cubans) and lowest (Dominicans) levels of suburbanization overall. With the exception of Colombians, Latin American groups tend to have lower suburbanization rates, while immigrants from Canada, Germany and the United Kingdom have suburbanization levels that mirror the overall U.S.-born population. These 2012 rates mark a noteworthy shift since 2000, a period that featured the foreign-born suburban population increasing at 13 times the rate (39 percent growth) of the native white suburban population (3 percent growth).
Figure 1 – Immigrant Suburbanization Rates by Country of Origin, 2012

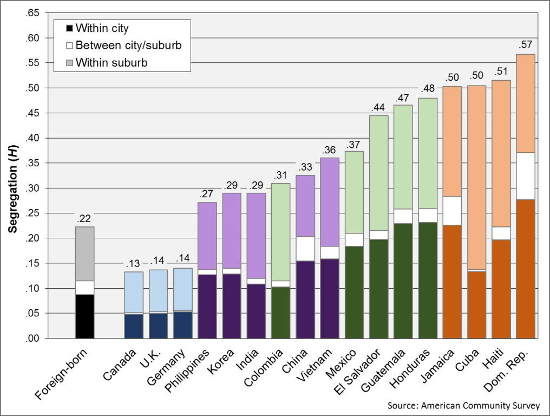
How segregated are immigrants in the metropolitan United States? What role does suburbanization play in their settlement patterns? Figure 2 addresses these questions by depicting the segregation levels of each of the 17 country-of-origin groups (color-coded by region as in Figure 1). Segregation is measured here with Theil’s H, an index which captures the degree to which two groups are distributed unevenly across metropolitan neighborhoods. U.S.-born whites are used as the reference group since they account for the largest share of the U.S. suburban population. Census tracts serve as the proxies for “neighborhoods”; these units approximate neighborhood geographical scales in large metropolitan areas. Ranging from zero to one, the H index is interpreted as the difference between the diversity of a metropolitan area and the average diversity of its constituent census tracts. High levels of segregation (H~1) occur when tracts are much less diverse than their metropolitan contexts, as occurs when immigrant enclaves are spatially isolated from predominantly white residential areas. Lower segregation (H~0) occurs when most neighborhoods reflect the metropolitan area as a whole, a situation in which immigrants are living side-by-side with the white population.
Figure 2 – Metropolitan Segregation by Country of Origin, 2012

The H scores provided in Figure 2 are metropolitan averages weighted by group size, reflecting the segregation experienced by the average group member. The typical Canadian, for example, lives in a neighborhood that is 13 percent less diverse than the metropolitan area in which she lives. This is a very low level of segregation, and immigrants from Germany and the United Kingdom are similarly integrated with native whites. The Asian origin groups occupy five of the next six spots, followed by the more segregated Latin American immigrant groups. The four Caribbean groups exhibit the highest segregation levels overall. In fact, they exceed the average segregation levels found for black and white metropolitan residents (H = .42). Given that many of these Caribbean immigrants would be perceived as “black” in an American context, this suggests that a persistent color line exists even for America’s most recent arrivals.
One useful property of Theil’s H is that it can be decomposed into geographic components. In other words, we can get a sense whether overall metropolitan segregation is due primarily to segregation occurring within large cities or within the suburban ring. The shading in the bars of Figure 2 gives some sense of the geographic contours of immigrant segregation. A comparison of the Dominicans and Cubans provides a useful illustration of the utility of this decomposition. These two groups experience high levels of segregation but the corresponding geographic contributions are quite distinct. Within-suburb residential differences (top segment of bar) account for nearly three-quarters of all of the residential segregation experienced by Cubans but just one-third of that experienced by Dominicans. If one could wave a magic wand and eliminate suburban residential segregation for Cubans, they would become as residentially integrated as immigrants from the U.K. Doing the same for Dominican suburbanites would have much less of an overall impact, still leaving them as segregated as Mexican immigrants.
Most of these immigrant groups became more segregated in the opening decade of this century even as they were rapidly suburbanizing. A similar geographic decomposition to that found in Figure 2 (not shown) reveals that, for most groups, increasing metropolitan segregation since 2000 is due primarily to increasing segregation within the suburbs. Koreans, Indians, Haitians, and Central Americans experienced the largest within-suburb increases. In many cases, growing suburban segregation offset declines occurring within cities. As a result, segregation within the suburban ring is accounting for an increasing share of immigrant segregation overall. Demographic data alone cannot fully illuminate whether these shifts are due to immigrant residential preferences, economic factors, housing discrimination, or some combination of the three.
A broader issue to consider is whether suburbanization is still emblematic of upward residential mobility. As suburban poverty rates rise in the United States, certain suburbanizing immigrant groups may become concentrated in aging, deteriorating inner-ring neighborhoods. Similarly, segregation does not necessarily indicate residential disadvantage. Immigrants arriving with more economic resources might choose to avoid homogeneous white suburbs and instead settle in emerging “ethnoburbs”. These two scenarios suggest that the interplay between suburbanization and segregation has become much more complicated in this new century.
This article is based on the paper, ‘Immigrant Suburbanisation and the Shifting Geographic Structure of Metropolitan Segregation in the United States’, in Urban Studies.
Featured image credit: Scorpions and Centaurs (Flickr, CC-BY-NC-SA-2.0)
Please read our comments policy before commenting.
Note: This article gives the views of the author, and not the position of USApp– American Politics and Policy, nor of the London School of Economics.
Shortened URL for this post: http://bit.ly/1MiSjgu
_________________________________
 Chad R. Farrell – University of Alaska Anchorage
Chad R. Farrell is an Associate Professor of Sociology at the University of Alaska Anchorage. His research interests include Urban inequality, Residential segregation and diversity, Community and neighborhood change, and Social demography.


