 The past five years have seen the Uber app emerge as a competitor for traditional taxi services in urban areas. Compared to taxis, Uber’s pricing is volatile and opaque, with users often having difficulty determining if their fare is actually cheaper. In order to address this problem, Anastasios Noulas and colleagues designed and launched the OpenStreetCab app, which uses open data to help users choose between Uber and Yellow Cabs in New York. Since its launch, OpenStreetCab has yielded an average estimated saving of $6 per journey across its users.
The costs of urban transport have always been at the heart of the debate amongst commuters, urban authorities and transport companies. A representative case that sparked a similar debate in the UK has been a 2011 study that was carried out by researchers in University College London and showed how the commuters on the London underground system could save hundreds of millions if they were to choose the travel plan that best matched their mobility patterns. Unfortunately, the choices of individuals are not always optimal in economic terms, and in the context of transport, an extra obstacle is added due to badly designed interfaces and ultra-complex ticketing systems.
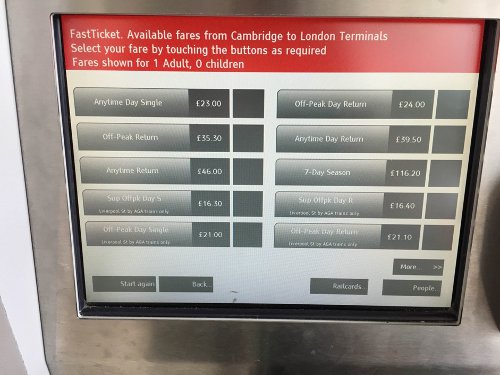
To give an example situation of the complexities commuters face, imagine a tourist using a terminal at one of the UK’s train stations: should they buy an Open Return, Off Peak Open Return or Off Peak Day Return ticket? The choices are many. The train is leaving in 5 minutes and tens of stressed out commuters wait behind you willing to by their ticket. Choosing the wrong ticket in this context, would certainly not come as a surprise.
Figure 1 – Rail ticket complexity in Cambridge, UK

Credit: Author
The above case demonstrates a mismatch between commuter expectations and the reality encountered in urban transport due to bad transactional system design. This is a systemic problem that yields high profits for transport companies at the cost of millions of individuals that commute daily in the UK’s cities.
Uber: Complexifying Taxi Economics in Real Time
In the case of taxi transport, troubles in pricing for commuters have traditionally been sourced to various cheats devised by individual drivers (altering meter readings, taking longer routes etc.), as opposed to systemic design problems. Thus, unlike large scale rail transport networks where the fallacy in effective pricing emerges from the top, in taxis problems may arise due to the bad attitudes of individuals providing the service. The arrival of Uber as a mode of taxi transport has come to change that though by enabling a – much wanted – driver review system through their app, but at the same time, it has introduced an unprecedented change in the nature of taxi transportation:
Pricing patterns can now change in every coming minute, driven by the algorithmic recipes put forward by Uber. Moreover, according to empirical findings demonstrated recently by researchers, Uber’s so-called changes in pricing can vary from one neighborhood to the next one in a city.
This translates to an extremely volatile pricing landscape in taxi transport with prices changing in real time in a manner that is hard to predict or trace. Moreover, the content of such algorithmic recipes is not known to the public, or authorities through well-defined means and thus the a-priori knowledge and transparency on pricing in urban transport that has been a norm for decades is effectively lost.
Attaining Pricing Transparency in Taxi Transport in the post-Uber era: The case of OpenStreetCab.
The cure to this newly introduced financial challenge to the taxi industry would certainly not be moving Uber off the map. Uber like technologies have introduced numerous positive opportunities in urban transport that we should acknowledge. At the same time however, there is a need to identify the mediums for integrating gracefully the new generation of disrupting technologies in our societies.
Open datasets are, at the moment, perhaps the most promising route towards realizing the opportunity of attaining economic transparency in a sector where prices change dynamically. In March 2015, we introduced OpenStreetCab, the first mobile application to allow for direct price comparison between taxi companies in New York City in real time. The project is a collaboration between the University of Namur in Belgium and the University of Cambridge in the U.K.
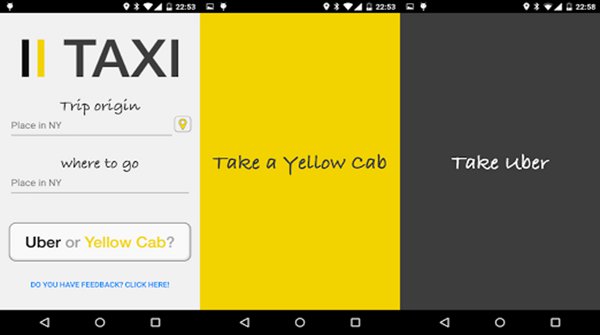
Figure 2 – A user perspective of OpenStreetCab

Note: As shown in the snapshot above users can set their trip and pick-up and drop-off addresses as they open the application. Simply by pressing a button they receive a response on the cheapest taxi provider for their trip.
As the snapshot of the app’s interface above, showing a pick-up and drop-off demonstrate, one has to input through the OpenStreetCab’s the address for an intended taxi route. OpenStreetCab then compares, in real-time, the price that Uber X (Uber’s cheapest service) would charge on that route, against historically charged fares by Yellow Cabs, the largest taxi fleet in the city. The users can then know which is the cheapest option for their preferred route by viewing an appropriate response on the app; a yellow colored frame if yellow cabs are cheaper, and a black one otherwise.
Uber prices become available through the company’s API, whereas historic prices on yellow cabs have become available through a dataset that was published by Chris Whong who obtained taxi trip and fare information exploiting the Freedom of Information Act. The full set of millions of records of mobility data can be downloaded and scrutinized by anyone here. OpenStreetCab is an example of how similar open datasets can become a prominent medium for innovation in the transportation industry that could benefit millions of urban commuters worldwide.
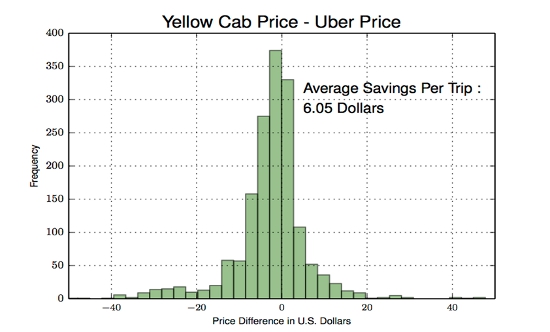
So far, the app has been used by more than 1,000 users in New York City, yielding an estimated average saving of almost $6 per taxi journey that has been queried through OpenStreetCab. This is not a negligible amount given that the average money spent on a trip is in the range of $10-15. In Figure 3 we provide an analytical viewpoint on these “savings” statistics by plotting the price differences between yellow taxis and Uber X by considering a sample of almost 1,500 journey queries generated by OpenStreetCab users.
Figure 3 – Distribution of price differences for journeys queried through the OpenStreetCab app

Note: An $0 difference implies an equal price between Yellow Cabs and Uber, a negative value implies that a Yellow Cab is cheaper, whereas positive values correspond to journeys for which Uber X was cheaper.
Our hope is that the successful reception of OpenStreetCab will encourage the production of similar works and technologies in the domain of urban transport. Disruptive technologies are without a doubt an opportunity for much wanted changes in city transportation, yet their integration needs to take place in a graceful and transparent manner, so both travelers and businesses alike can benefit.
This article is based on the paper, ‘OpenStreetCab: Exploiting Taxi Mobility Patterns in New York City to Reduce Commuter Costs’.
Featured image credit: Delkarm (Flickr, CC-BY-NC-SA-2.0)
Please read our comments policy before commenting.
Note: This article gives the views of the authors, and not the position of USApp– American Politics and Policy, nor of the London School of Economics.
Shortened URL for this post: http://bit.ly/1Ja5tvm
_________________________________
 Anastasios Noulas – University of Cambridge
Anastasios Noulas is a research associate at the Computer Laboratory of the University of Cambridge in the UK. He has over seven years of interdisciplinary scientific research experience on spatial data mining, dynamically evolving social networks, human mobility modeling, recommender systems and location based services. Previously he worked as a data scientist for Foursquare in New York and Telefonica Research in Madrid.


