 In the referendum, income inequality and poverty boosted Leave votes, in addition to geographical differences and larger shares of less educated and older people in UK regions, according to regression analyses carried out by Zsolt Darvas. The study points to a key lesson politicians all over the world can learn from the referendum: high inequality and poverty undermine personal well-being and social cohesion, which in turn can trigger protest votes at the ballot box.
Did income inequality, poverty and unemployment contribute to ‘leave’ votes in the UK referendum on EU membership? To answer this question, I estimate some regressions to uncover the determinants of ‘leave’ votes and voter turnout.
Opinion polls and post-vote analyses (for example here and here) suggested that older, less-educated and poorer people tended to vote for leave. Geography also seems to have played a major role: while the share of ‘leave’ votes was 55.5 percent in England outside London and 52.5 percent in Wales, it was the minority position at 44.2 percent in Northern Ireland, 40.1 percent in London and 38.0 percent in Scotland. And while immigration was one of the hottest topics in the Brexit debate, Emmanuel Mourlon-Druol noted that there was no automatic link between the presence of immigrants and the share of leave votes.

A simple correlation analysis (which was done in previous analyses of this issue) can provide useful insights, but does not prove causality. A correlation between two variables could be caused by a third variable, while a zero correlation does not exclude causality between two variables. There are interactions between indicators, which makes it difficult to interpret a correlation coefficient. For example, younger people tend to be better educated, while older people tend to be richer. The proper tool to assess the factors that influenced the ‘leave’ vote is a regression analysis that jointly considers various determinants. It also allows the importance of the various factors to be assessed.
I therefore use a regression analysis. As well as looking at age, education, income, immigration and geographical factors, I analyse the possible influence of three social indicators: income inequality, poverty and unemployment.
Instead of using data from opinion surveys, which are typically conducted by asking a few thousand people and therefore are subject to sampling errors, I use socio-economic data published by UK statistical agencies (see the data description in the annex). For example, a more recent opinion poll concluded that the turnout among the young was almost double than what was suggested by the first opinion polls conducted after the referendum. The data I use is not subject to such uncertainties related to opinion polls.
Regressions
I estimate two types of regression: one aims to uncover the determinants of the share of the ‘leave’ vote, while the other explores the reasons behind voter turnout. I use various social and economic variables as possible determinants.
I also include dummy variables for Scotland, Northern Ireland, Wales and London in the regressions, because of clear geographical differences in voting behaviour. Furthermore, inner London is very different from the rest of England: disposable income is more than twice as high as in the rest of the UK, the share of people with university degree is almost twice as high and the share of immigrants is almost four times as high.
For my calculations, I aggregate the data for the 173 NUTS3 (Nomenclature of Territorial Units for Statistics, 3rd level) regions of the UK. Thereby, I estimate cross-section regressions for these 173 regional units.
Determinants of ‘leave’ votes
I wish to include the shares of both the young (aged from 20-34 years) and the old (65 years and older) in the resident population, but these shares strongly correlate with each other and it is thus not wise to include them jointly (because of the so-called multicollinearity problem). Similarly, the shares of people with a degree and people with no qualification strongly correlate. Therefore, I estimate four versions of the regression, corresponding to the 2×2 options of age and educational attainment (Table 1).
Table 1: Regression estimate for the determinants of the share of ‘leave’ votes
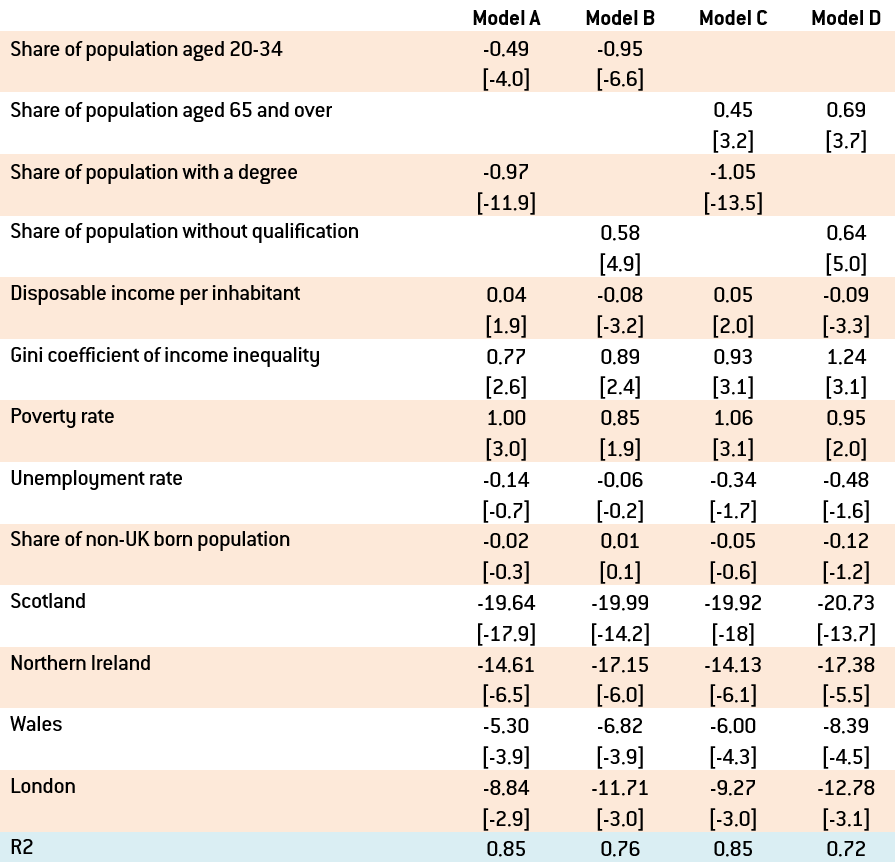
Source: author’s calculations. Note: the sample includes the cross section of the 173 UK regions; t-ratios are reported in brackets below the point estimates; the regression includes a constant too. A parameter estimate is significantly different from zero at 10% significance level if the absolute value of the t-ratio is larger than 1.7.
Table 1 allows a number of conclusions to be drawn about the social, economic and geographical factors that influenced the share of ‘leave’ votes in UK regions:
- The parameter estimate of the share of young people is negative, implying that a higher share of young people is associated with fewer ‘leave’ votes. The point estimate of the parameter of the young is -0.5 in the first model, implying that a 1 percentage point higher share of the young (eg 21 percent instead of 20 percent) is associated with a 0.5 percentage point lower vote for ‘leave’.
- In contrast, the estimated parameter of old people is positive, confirming that old people tended to vote for ‘leave’.
- The share of the workforce with a degree was a major factor for ‘remain’ (since the parameter is negative), while a greater share of people with no qualification supported ‘leave’.
- It is noteworthy that the share of young people positively correlates with the share of people with a degree, most likely because the number of university graduates increased over time; older people had fewer opportunities to obtain a degree when they were young. Yet my regression results show that the shares of both the young and the well-educated had a statistically significant impact on the results.
- Disposable income per inhabitant does not have a statistically robust effect. When we estimate a simpler regression model which includes only the four regional dummy variables (Scotland, Northern Ireland, Wales and London) and disposable income, the parameter estimate of disposable income is -0.13, suggesting that people in poorer areas tended to vote for ‘leave’: a 10 percentage point lower income than the UK average is associated with a 1.3 percentage point higher share of ‘leave’ votes. However, in the four regression models reported in Table 1, the sign of the parameter estimate of disposable income varies, suggesting that average income is not a robust determinant of ‘leave’ votes. A possible reason for the lack of a robust effect of disposable income per capita is that it has a high positive correlation with the share of people with a degree and a strong negative correlation with the share of people without qualifications: well educated people tend to earn more. Yet when both education and income are included in the regression, education turns out to be statistically significant, while income does not.
- The estimated parameter of the Gini-coefficient of income inequality is positive and statistically significant. The parameter estimate is about 0.9, implying that 1 percentage point higher income inequality (eg 35 instead of 34) boosted the share of ‘leave’ votes by about 0.9 percentage points. In my view this is a relatively large magnitude highlighting the importance of income inequality.
- The poverty rate is also robust and statistically significant, with a parameter estimate of about 1, implying that a 1 percentage point higher poverty rate boosted the share of ‘leave’ votes by 1 percentage point. This result highlights the importance of poverty as a determinant of ‘leave’ votes.
- The parameter estimate of the unemployment rate is statistically insignificant, suggesting that beyond the influence of inequality and poverty, unemployment did not play an additional role in the votes.
- The share of non-UK born population does not have a statistically robust effect. When we estimate a simpler regression model which includes only the four regional dummy variables (Scotland, Northern Ireland, Wales and London) and the share of non-UK born population, the parameter estimate of non-UK born population is -0.45, suggesting that a larger presence of immigrants is in fact associated with less ‘leave’ votes. The reason is that immigrants went to economically more dynamic areas where there are more young and better educated people, who tended to vote ‘remain’. But after controlling for these socio-economic factors, immigration does not have an additional significant impact.
- The four area dummy variables are all statistically significant with negative parameters. For Scotland, the parameter estimate is about -20. This implies that after controlling for socio-economic characteristics, the share of ‘leave’ votes in Scotland was 20 percentage points lower than in England outside London. The same parameter for Northern Ireland is about -15, for Wales it is about -6 and for London it is about -10. Clearly, beyond socio-economic factors, geography and national identity also played a major role in voters’ choices.
Finally, let me highlight that the regression fit is quite accurate. The coefficient of determination (R2) is 0.85 for the first and third regressions, which is quite high given that I use a cross-section sample. When I include only the four area dummy variables, the R2 is 0.51, highlighting that the socio-economic variables in the model explain much share of the variability of votes across the 173 regions. Figure 1 shows that in most of the 173 regions, the fitted value by the regression tracks the actual votes remarkably well.
Figure 1: Shares of ‘leave’ votes in the 173 UK regions and the fitted values by the estimated regression
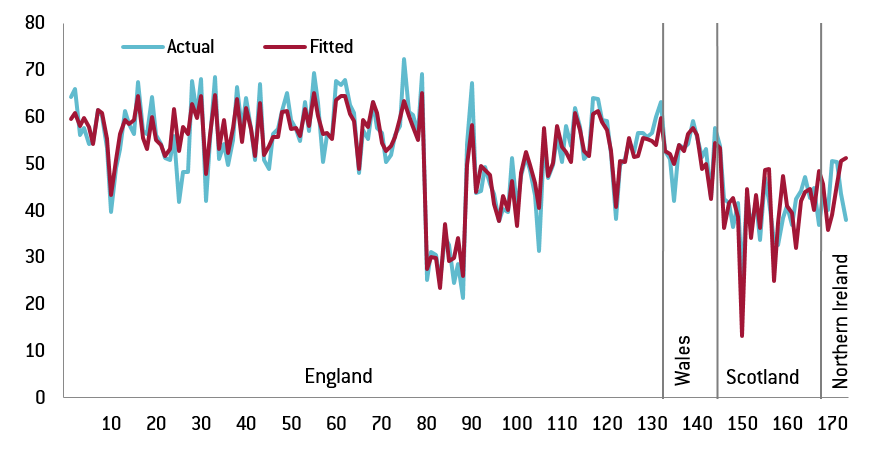
Source: author’s calculations. Note: regions from 1-133 are from England, regions from 134-145 are from Wales, regions from 146-168 are from Scotland and regions from 169-173 are from Northern Ireland. Inner London is from 80-88, while outer London is from 89-100. The first regression (Model A) of Table 1 is used.
Who voted?
I also estimated the four versions of the regression for studying the determinants of voter turnout (Table 2).
Table 2: Regression estimate for the determinants of turnout
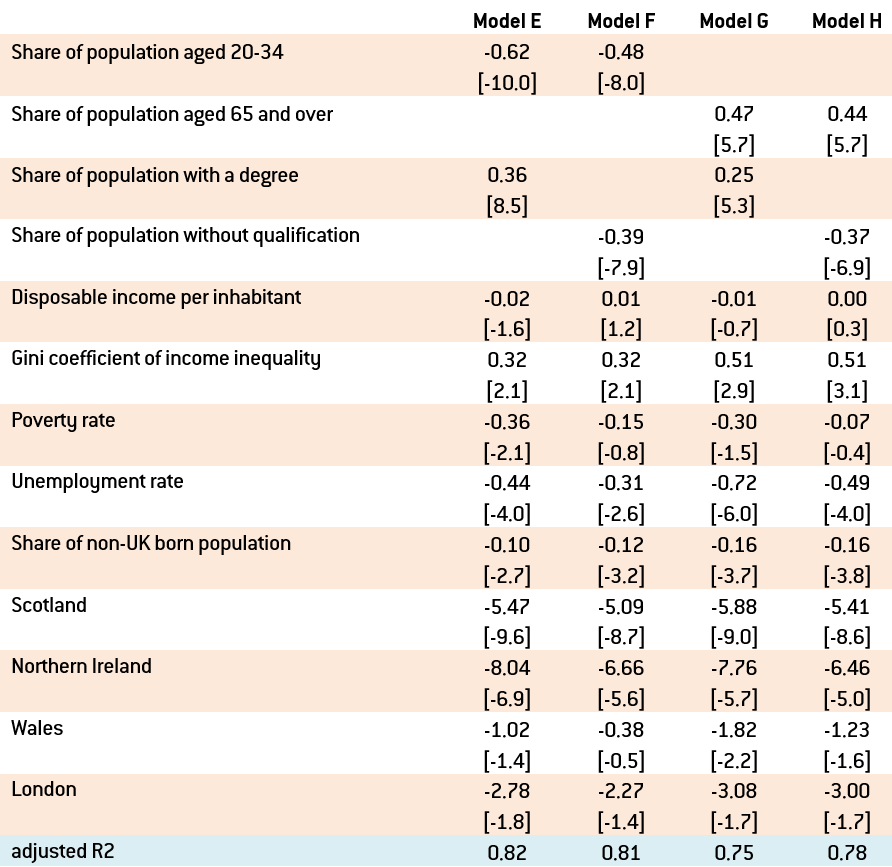
Source: author’s calculations. Note: the sample includes the cross section of the 173 UK regions; t-ratios are reported in brackets below the point estimates; the regression includes a constant too. A parameter estimate is significantly different from zero at 10% significance level if the absolute value of the t-ratio is larger than 1.7.
Table 2 offers interesting insights into voting inclinations:
- Turnout was lower in areas where young people are a higher share of the resident population. Therefore, the young, the main supporters of ‘remain’, abstained more from voting.
- By contrast, older people (many of whom are ‘leave’ supporters) cast their votes in a higher proportion.
- People with a degree (‘remain’ supporters) tended to vote in higher proportions, while people without qualifications (‘leave’ supporters) abstained more from voting.
- Average disposable income in a region was not a statistically significant determinant of the turnout.
- Among the three social indicators, inequality contributed positively to the votes, while greater poverty and higher unemployment discouraged people from voting. These results together with the finding for uneducated people, suggests that disadvantaged people tended to vote in smaller proportions.
- The presence of immigrants had a negative and statistically significant impact on turnout, though quite small.
- Finally, even after controlling for the socio-economic variables, turnout was significantly lower in Scotland, Northern Ireland and London (in the strongholds of ‘remain’) than in England excluding London.
The regression fit is also remarkably strong for the turnout equation. The coefficient of determination is 0.82 for the first model in Table 2 and Figure 2 shows that the fit by the model tracks actual voter behaviour quite well.
Figure 2: Turnout in the 173 UK regions and the fitted values by the estimated regression
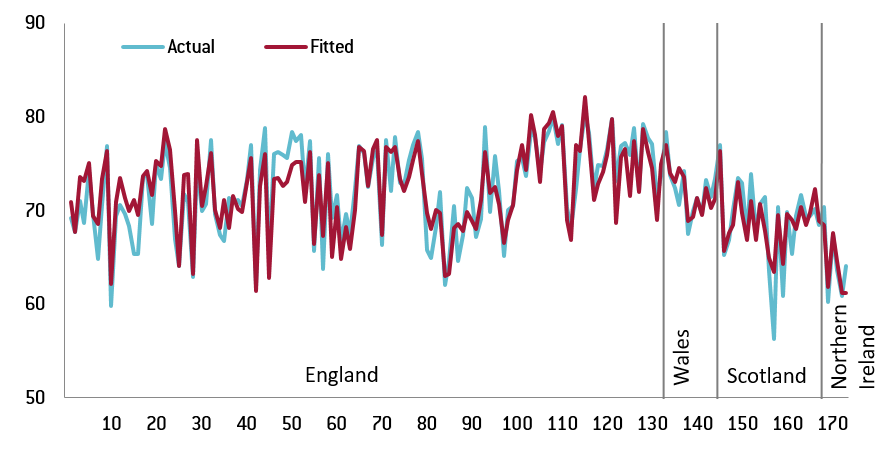
Source: author’s calculations. Note: regions from 1-133 are from England, regions from 134-145 are from Wales, regions from 146-168 are from Scotland and regions from 169-173 are from Northern Ireland. Inner London is from 80-88, while outer London is from 89-100. The first regression (Model E) of Table 2 is used.
Summary and implications for inclusive growth
Using a regression analysis based on hard data from statistical offices (as opposed to using the results of opinion surveys) for 173 UK regions, my results confirm that younger and better educated people voted for ‘remain’ in greater proportions and older and uneducated people tended to vote for ‘leave’. Since the UK is characterised by low intergenerational mobility, that is, the children of poorer and lower educated parents tend to become poorer and lower educated when they grow up, the result highlighting the importance of educational level partly reflects the socioeconomic background of voters.
There was a clear geographical pattern in which Scotland, Northern Ireland and London were for ‘remain’, highlighting the role of national identity. The actual presence of immigrants did not have a significant effect on the results, supporting Emmanuel Mourlon-Druol’s conjecture that it was the perception that immigration could be a problem, rather than their actual presence, that influenced the vote. Average household income did not play a role either, after we control for several socio-economic characteristics of the regions. Turnout was lower among disadvantaged people and in areas belonging to the strongholds of ‘remain’: the young and residents of Scotland, Northern Ireland and London voted in lower proportions.
Despite the clear overall vote for ‘leave’, EU leaders may read a positive message from the referendum result: the young (who will dominate the population in the coming decades) and the well-educated (who may be able to understand better the benefits of EU integration) were more in favour of EU membership.
A key contribution of my calculations is to show with regression analysis that in areas where income inequality and poverty are higher, there were more ‘leave’ votes, even after controlling for the influences of socio-economic and geographic factors. This finding calls for more inclusive growth, which is defined by the OECD as “economic growth that creates opportunity for all segments of the population and distributes the dividends of increased prosperity, both in monetary and non-monetary terms, fairly across society.” In the UK, income inequality – a key indicator of inclusive growth – is almost the highest in the European Union. Theresa May, the new UK prime minister, has rightly emphasised very strongly the importance of a social reform to reduce the inequality of opportunities.
Overall, high inequality and poverty undermine personal well-being and social cohesion, and can also boost protest votes in referenda and elections. This is another key lesson that politicians in other countries should learn from the Brexit vote.
Annex: data description
I use a cross section data for the 173 NUTS3 (Nomenclature of Territorial Units for Statistics, 3rd level) regions of the UK. Data sources and transformations were the following:
Referendum results: the dependent variable in the regressions reported in Table 1, included as % of ‘leave’ votes. The other dependent variable is the % turnout (Table 2). The Electoral Commission provides results for 382 UK regions, of which Northern Ireland is a single region. Gibraltar, a very small territory of the UK, is also among the 382 regions. With the exception of Northern Ireland and Gibraltar, I used the local authority districts (LAD) to NUTS3 region mapping of the Office for National Statistics to calculate the referendum results for the NUTS3 regions. There is an unambiguous mapping between the LADs and NUTS3 with the exception of three Scottish LADs, for which I distributed the votes as half-half (when an LAD was part of two NUTS3 regions) and third-third-third (when an LAD was part of three NUTS3 regions). Northern Ireland has five NUTS3 regions. I found a breakdown of results for 18 Northern Ireland constituencies at BBC that I approximated to the five NUTS3 regions using maps.
Share of young (from 20-34 years) and old (65 years and older): included in the regression as the % of resident population. The source is Eurostat’s ‘Population on 1 January by five year age group, sex and NUTS 3 region [demo_r_pjangrp3]’ dataset.
Education: included in the regression as the % of working age population. For England and Wales the source is ‘Table KS501EW, 2011 Census: Qualifications and students, local authorities in England and Wales’ from the Office for National Statistics. For Scotland the source is Scottish Statistics for qualifications of working age adults, also for 2011. For Northern Ireland the source is the ‘Labour Force Survey Local Area Database’ of the Northern Ireland Neighbourhood Information Servic (NINIS), also for 2011.
Gross disposable household income (GDHI) per head at current basic prices: included in the regression as the UK average = 100. The source is Office for National Statistics for all UK’s NUTS3 regions.
Non-UK born resident population: included in the regression as % of resident population. The Office for National Statistics (ONS) provides detailed regional data for England, Wales and Scotland, plus the total for Northern Ireland. For Northern Ireland, NUTS3 data is provided by the Northern Ireland Neighbourhood Information Service (NINIS). However, since the total for Northern Ireland as reported by ONS and by NINIS are different, for consistency, I adjusted proportionally the NINIS data to match the aggregate data provided by ONS. For England, Wales and Scotland data is available at the local authority districts (LAD) level: to calculate aggregates at the NUTS3 level, I added up the number of non-UK born residents and the total number of residents for each NUTS3 region and calculated the ratio of non-UK born resident population from these aggregates.
Gini coefficient of income inequality (after taxes and transfers) in 2011: included in the regression as %. The source is the Regional Well-Being dataset of the OECD. This data is available for the 12 UK NUTS1 regions and therefore I use the same value for each NUTS3 region within a NUTS1 region.
Poverty rate (after taxes and transfers) in 2011 – Regional headcount ratios for disposable income, with poverty line set at 50% of the national median income: included in the regression as %. The source is the Regional Well-Being dataset of the OECD. This data is available for the 12 UK NUTS1 regions and therefore I use the same value for each NUTS3 region within a NUTS1 region.
Unemployment rate in 2014: included in the regression as %. The sources are Office for National Statistics for England and Wales; Northern Ireland Neighbourhood Information Service (NINIS) for Northern Ireland and The Scottish Government for Scotland. Data is available at the local authority districts (LAD) level: to calculate aggregates at the NUTS3 level, I added up the number of unemployed people and the number of people in the labour force for each NUTS3 region and calculated the unemployment rate from these aggregates.
This article was originally published at Bruegel. It gives the views of the author, and not the position of the Brexit blog, nor of the London School of Economics. Featured image credit: Eric Pouhier / Wikimedia Commons. (CC BY-SA 2.5)
Zsolt Darvas is a Senior Fellow at the think tank Bruegel.


A robust analysis, thank you. The Referendum was a Blue on Blue political fight for the right wing to exit the moderating influence of the centrist consensus in a large and diverse Europe in order to manipulate repression via an easier to control Westminster. Given the shameful propaganda emanating from the 75% of the Press owned by four protectionist billionaires it is a wonder the result was so close but not that there is a low correlation with actual immigration. Ironic that the terms of Brexit hangs on Free movement of foreigners, EU or no. I think you might discover some hubris on the part of George Osborne who targeted his “Austerity” cuts at Labour areas as “They don’t vote for us.” From a rough juxtaposition of % cuts to Police budgets and %Leave votes I’d guess at a correlation close to 1.