David Spiegelhalter (University of Cambridge) and Anthony Masters (Royal Statistical Society) highlight some of the key findings from their book, COVID by Numbers: Making Sense of the Pandemic with Data.
Writing a book about technical subjects for a non-technical audience was a challenge. In the autodidactic tradition of Penguin, COVID by Numbers tries to be broad but concise. It has many graphs, but no maths, and is arranged as answers to specific questions. The book is intended to be both a resource to counter misinformed claims and useful background for any public inquiry into the pandemic, and focuses mainly on the UK, particularly England and Wales.
What it is not is a critique of government policy, or an in-depth examination of specific issues. We keep away from the blame and speculation that is common in media coverage of COVID. Unless you stop them, the media will ask what should have been done, what mistakes were made, and what will happen in six months time. We haven’t got a clue, and we are not going to start blaming anyone. During the pandemic, statisticians have overwhelmingly avoided taking sides on what should be done. We are proud of that professional approach.
Once you begin to think about it, every aspect of the virus is numerical and statistical — everything from case numbers, how it spreads, diagnosis and testing, how many people become ill, whether they go to hospital and if they die. Everyone is obsessed with the effects of different interventions like masks and lockdowns. Vaccine side effects and epidemic modelling add to the data, and we deploy a staggering range of statistical ideas — from Bayes’ theorem to complex modelling, adjustment, and logical regressions. Everything is being used behind the scenes, even if we don’t talk about it.
The daily dashboard was the focus of interest, though it is less interesting now. In the past, as a rough rule of thumb, doubling the number of positive tests yielded the actual. number of cases, because not everyone chooses to get tested. We know this because of the COVID Infection Survey run by the Office for National Statistics, which tests a random sample of the population.
During the initial wave most people with COVID did not infect anyone else
The Omicron wave has been particularly staggering. In London, for example, cases were at a low level. Then they began to double every two days, before dropping down as BA1 abated. Half the children in the country caught COVID during this wave. Nearly all have now had the virus, which means vaccination will only carry a marginal gain for children of primary age.
During the initial wave most people with COVID did not infect anyone else, even in a susceptible population. As Wellcome Institute research has shown, while most of those with the virus do not infect anyone, some go on to infect 10-20 people. Even in the Alpha wave, over six in 10 did not infect others.
With COVID, the main statistical problems do not concern complex statistical ideas, but with what we actually mean, for example by ‘a COVID death’. Currently only 70 percent of deaths within 28 days of a positive test actually involve COVID and have it listed on the death certificate. Then around two-thirds of deaths with COVID on the certificate are registered as caused by COVID: in the rest, it is a contributory factor.
The risk of dying from COVID increases massively with age. In England and Wales, over-90s had 35,000 times the lethal risk of schoolchildren between March 2020 and March 2021. The median age that people die from the disease is also the average age they die from other causes. This does not mean, however, that these people would have died anyway. Some analyses suggest the mean average of years of life lost was about 10.
The pandemic, and the measures taken to fight it, were a net life saver for young people in England and Wales, because society became less risky and traffic and other respiratory diseases fell. There were over 300 fewer deaths of 15- to 29-year-olds in 2020 compared with the previous five-year average, although some of this deficit is due to delays in coroners’ reports. This includes 115 COVID deaths.
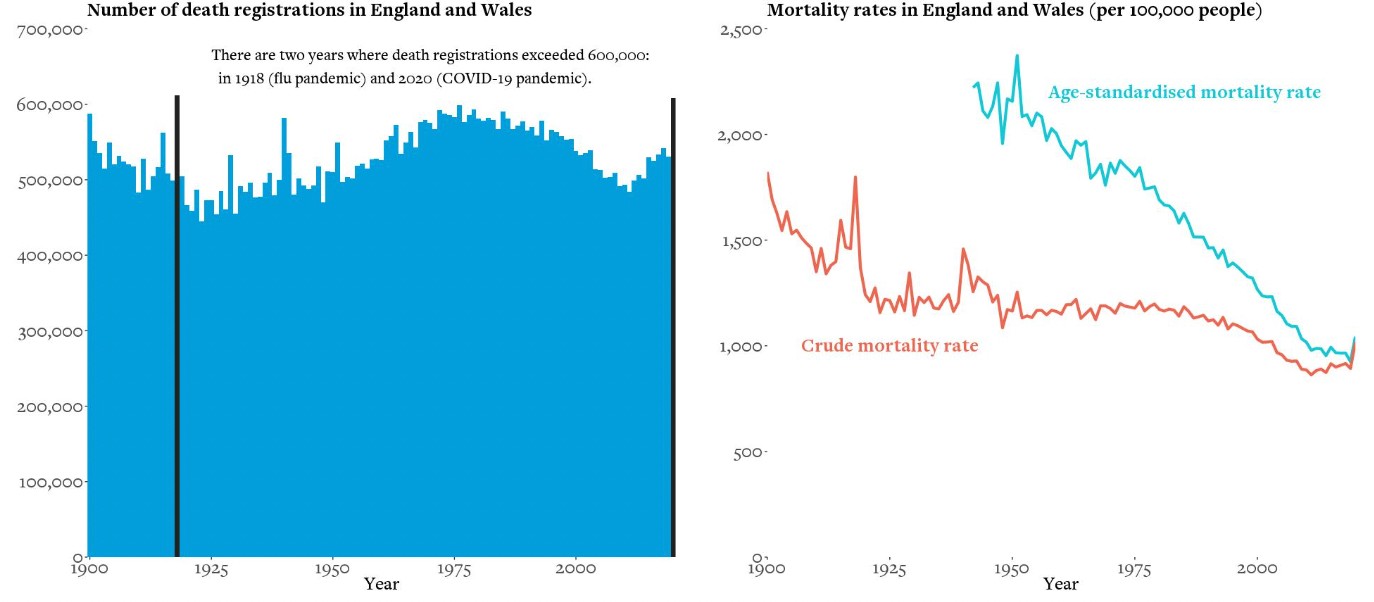
Figures 1 and 2: Death registrations of civilians from all causes in England and Wales, with age-standardised and crude mortality rates by year

Source: Office for National Statistics, 1900 to 2020 (provisional)
Some people suggested that lockdowns would encourage us to drink ourselves into a stupor in front of the TV. That did not happen: there was a small fall in alcohol consumption in 2020 compared to previous years. However, heavier drinkers drank even more and lighter drinkers stopped, which increased the overall harm from alcohol.
Deaths at home have increased by 35 percent
The extent to which social distancing and lockdowns suppressed seasonal influenza was remarkable. Cases fell to almost zero. Although there have been several long periods of excess deaths in England and Wales, this meant that non-COVID deaths were low during the second wave. Given that we have now lost two years of exposure and immunity, the consequences for next winter could be very worrying indeed. But deaths due to respiratory diseases are now lower than they were before the pandemic.
Over 608,000 people died in the UK in 2020, the highest number since 1918, reversing a decade of improvements in mortality rates. Deaths at home have increased by 35 percent. We are not sure why (possibly a reluctance to go to hospital), and we do not know about the quality of these deaths. Statistics cannot tell us whether this rise is a good or bad thing.

Life satisfaction among adults in Britain has yet to return to its pre-pandemic level, with a big dip after Christmas 2020 when the third national lockdown began. This has led to much more pressure on mental health services.
We have tried to address three of the most common areas of misinformation around the pandemic.
The case-demic: ‘Most positive tests are false positives’
When the prevalence of COVID is low, false positive tests can outnumber the true positives. But when cases rose during the autumn of 2020, we saw a subsequent rise in hospital admissions and deaths, which gives us confidence that these are not false positives. Similarly, at the rock bottom of virus prevalence, in August 2020, 208,730 tests yielded only 159 positives, putting an upper bound on the false-positive rate.
‘People are dying with COVID, not from it’
There are three different ways of counting COVID deaths in England. Public health surveillance catches those dying within 28 days of a positive test. But counting death certificates which mention COVID gives a higher number, in part due to limited testing. Of those, about 9 in 10 have had the disease as the underlying cause of death (although this proportion is now lower). Little wonder it gets complicated.
‘COVID is no more lethal than flu’
The risk of dying from COVID varies enormously according to age, but for rich countries before vaccines, the infection fatality rate (IFR) was about 1.1 percent. This has changed somewhat since the vaccine rollout, post-infection immunity, and the Omicron variant. For seasonal influenza, it is about 0.1 percent. Overall, IFR is 0.14-0.42 percent in low-income countries and 0.78-1.79 in high-income countries.
Statistics are summaries of the data. Like averages, they will behave differently for different underlying distributions, and there will be uncertainty about the past, present and future. The numbers do not speak for themselves: we have to interpret them.
This post represents the views of the authors and not those of the COVID-19 blog, nor LSE. It is based on an LSE Department of Statistics event with David Spiegelhalter and Anthony Masters on 7 March 2022.


