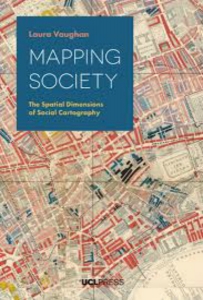
In Mapping Society: The Spatial Dimensions of Social Cartography – available to download here for free – Laura Vaughan offers an analysis of how maps have both described and shaped social phenomena. This is a scholarly and thoroughly researched book that unpicks the context behind many of the foremost examples of social cartography, finds Inderbir Bhullar, and reveals how the layout of cities can exacerbate or ameliorate social ills.
Mapping Society: The Spatial Dimensions of Social Cartography. Laura Vaughan. UCL Press. 2018.

When walking along Kingsway, among its London plane trees and traffic running north and south, it can be hard to imagine what preceded this grand imitation Parisian boulevard. The road didn’t spring from wasteland or (brown)fields, but instead emerged from the bulldozed remains of a series of streets, alleys and hidden courts over a century ago. According to a souvenir pamphlet called Opening of Kingsway and Aldwych by His Majesty the King, Accompanied by Her Majesty the Queenfrom 1905, the construction of the road and the accompanying Aldwych was a necessary improvement to an area that had been home to ‘a large amount of insanitary property only fit to be demolished’ (LCC, 5).
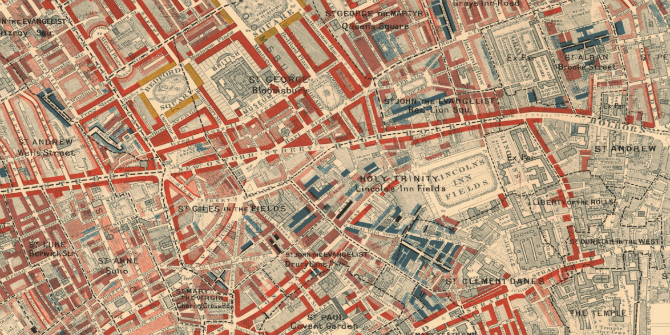
Charles Booth’s Victorian poverty maps, created before and during the slum clearances, can give us a sense of what the area was like, with splashes of blues and black across lost streets indicating degrees of recurrent poverty. UCL Professor Laura Vaughan, mindful of the power of maps to not only reflect but also shape our understanding of places and people, has used Booth’s map of the whole pre-Kingsway area to adorn the cover of her recent book, Mapping Society: The Spatial Dimensions of Social Cartography.
Professor Vaughan has spent two decades analysing and unpicking the symbiotic links between cities and those who live within them. Her book provides an excellent guide to much of this work and places historical ‘social cartography’ at the centre of an analysis that shows how such maps have both described and shaped social phenomena.
Mapping Society begins with an overview of how maps have been used to illustrate various societal concerns. Nineteenth-century social empiricists, with their thirst for gathering information and data to help better explain society, saw the potential for maps to display such raw data and help tame the underlying knotty complexity. Yet, as is made clear, making data fit the visual iconography and classification schemes of maps could change and distort the meaning, creating a tension between the apparent neutrality of the maps and the issues they were revealing.
 Image Credit: Cropped Printed Map Descriptive of London Poverty 1898-1899. Sheet 6. West Central District. Covering: Westminster, Soho, Holborn, Covent Garden, Bloomsbury, St Pancras, Clerkenwell, Finsbury, Hoxton and Haggerston. LSE reference no. BOOTH/E/1/6 (LSE Library No Known Copyright Restrictions)
The first chapter explores how maps are ‘objects laden with meaning, which reflect the context of their creation’ (7) and highlights the importance of understanding and critiquing such context. What then follows is a series of chapters, each focusing on a different ‘social ill’ that has been the subject of cartographic analysis, starting with maps of disease, health and housing; followed by Booth’s study of London poverty; later investigations into poverty and social isolation after and beyond Booth’s London; maps of race, migration and religion; and, finally, depictions of crime and disorder.
The book makes use of a considerable number of sources and uses them to tell many fascinating and sobering stories. While the maps themselves are often historic, Vaughan also showcases contemporary research which has been carried out using older maps and sources. In the first chapter she draws attention to Richard Keller’s work, which showed the impact of the 2003 heatwave on Paris. Thousands of people died following little respite from record high temperatures both night and day. Keller was able to draw significant parallels between the deaths in 2003 with the patterns of mortality as depicted on a map of the 1849 Paris cholera epidemic. Residents living in certain parts of the city were still more likely to be at risk from such health crises a century and a half later.
The Parisian maps of Chapter One showed how the outcomes of repeated patterns of spatial inequalities as shown on maps could have dire consequences for the health of city residents. Chapter Five, with its focus on race, gives examples of how data and information displayed on maps could be used for much more expressly prejudiced purposes. The ‘redline’ maps were ostensibly drawn to show credit risk for mortgages and loans across different American cities in the 1930s. Their gradation ran from highest credit worthiness (A) to lowest (D) and areas were shaded different colours in relation to those grades. Vaughan reveals that whilst the grades were assigned according to relatively benign-sounding categories such as ‘transportation methods’, ‘topography of the area’ or ‘age and type of building’, almost inevitably given the highly racialised patterns of settlement, areas predominantly occupied by black people were much more likely to be graded D. Existing inequalities were thus exacerbated as black citizens found it much harder, if not impossible, to gain access to financial credit in order to start businesses or purchase property.
Interestingly, Vaughan contrasts such enforced segregation of city residents with the much more fluid boundaries found in an immigrant quarter such as London’s Chinatown, which in contrast with segregated urban settlements, possesses ‘no clear boundaries’ (163): the warp and weft of daily, monthly and yearly patterns gradually modifies the population and interactions. Similar patterns of ‘quite high rates of commercial and cultural interchange’ (13) were also found in Venice’s Jewish Ghetto, despite it being an enforced exclusionary zone where Jewish people were forced to live.
The idea of cities as places of segregation and integration is key and referenced throughout the book. One of the principal methodologies used by Vaughan and other researchers to show how cities can segregate or integrate populations is space syntax analysis. This method is closely associated with the UCL Bartlett Faculty of the Built Environment where it was formulated and where Vaughan is based. The appendix of the book includes a fuller explanation of this methodology, but it essentially takes into account the ways in which the spatial configuration of cities (particularly streets and thoroughfares) can help or hinder interactions among people.
Several space syntax analyses are made in the book, including an example in Chapter Three which overlaid Booth’s poverty map with a modern map showing how different streets were more or less accessible. The more accessible streets were given ‘warmer’ colours such as oranges, yellows and reds, and the streets which were less well integrated were shades of cooler blue. The space syntax model confirmed Booth’s socio-economic findings and showed that ‘the main streets classified as ‘‘middle class’’ being markedly more likely to be coloured in the warmer shades of integration. In parallel there were localized clusters of very poor streets, which the analysis found were physically cut off from the life of the city’ (84).
Mapping Society is a scholarly and thoroughly researched book which unpicks the context behind many of the foremost examples of social cartography. The research of W.E.B Du Bois, the Hull House Movement, Booth and Joseph Rowntree inevitably form the core of the analysis, but these canonical examples are buttressed with numerous other social investigations that have used the spatiality of urban problems to inform their studies. Vaughan does give a platform to analyses of modern social issues and contemporary research, though this is less prominent given the book’s historical focus. The modern methodological tool of space syntax analysis effectively underpins the work and reveals how the layout of cities can exacerbate or ameliorate social ills, bridging the gap between the illustrations of the city and our lived experiences traversing its streets.
Please read our comments policy before commenting.
Note: This article is provided by our sister site, LSE Review of Books. It gives the views of the author, not the position of EUROPP – European Politics and Policy or the London School of Economics.
_________________________________
Inderbir Bhullar – LSE
Inderbir Bhullar is curator of economics and social policy at LSE Library where he was worked since 2013.


