By Maksim Malyy (Skolkovo Institute of Science and Technology), Zeljko Tekic (Higher School of Economics) and Tatiana Podladchikova (Skolkovo Institute of Science and Technology)
New ventures are extraordinary difficult to analyse (especially during their early phases of evolution), due to the absence of objective publicly available data on their progress. Billions of unique and powerful digital traces however are created every single day and recorded on Google Trends. The authors find a strong correlation between user search data on Google Trends and company valuation, particularly in the case of ‘unicorns’ and B2C digital platforms.
—
Startups and technology-based new ventures (TBNVs) that grow out of them are extremely important to local, regional and national economies. Such enterprises produce a significant number of highly skilled jobs, create new value for users and occasionally bring about disruption, transforming the logic of how things are done in established industries. The question of how startups grow is equally important; unfortunately however, empirical data to answer this question is lacking.
Many models have been proposed: the trivial “J-curve” with exponential organisations (Ismail 2014), the more complex models of Greiner (1998) and Adizes (1999), and dozens of others. Although these models acquired huge popularity in the field and brought significant value to the understanding of organisations’ evolution, all of them are conceptual in nature and lack empirical support. Ultimately they only partially reflect the real picture.
Figure 1
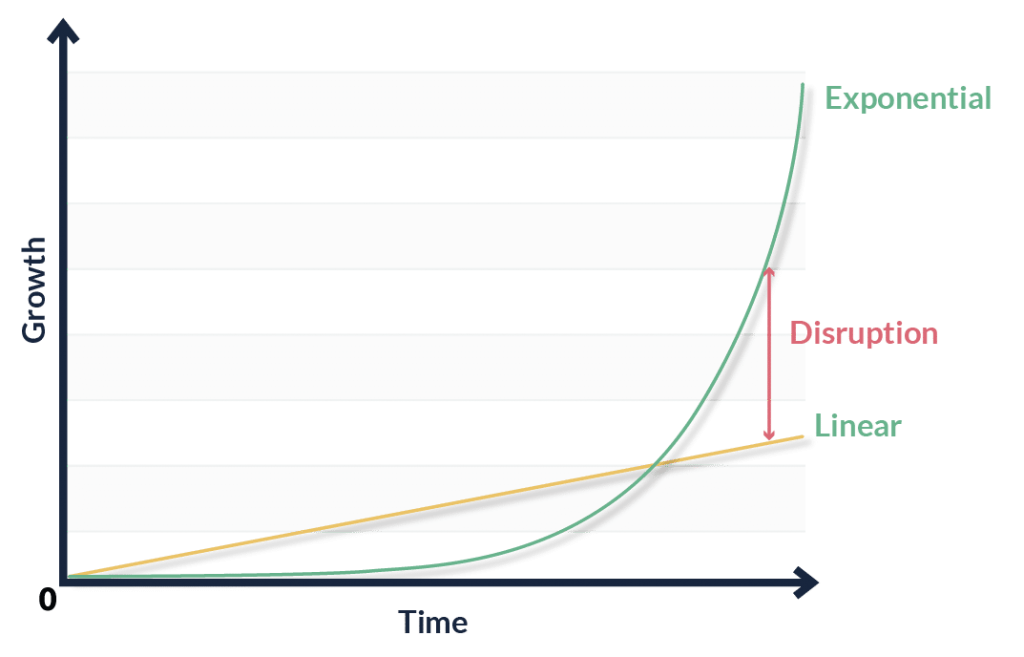
(a) Linear vs. Exponential (Ismail, 2014)
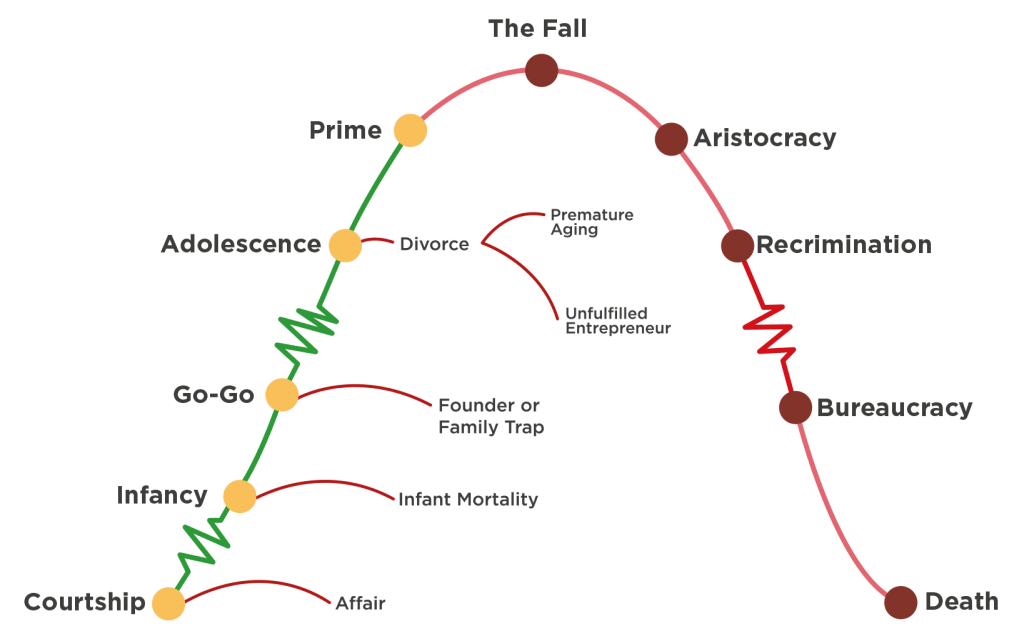
(b) Corporate lifecycle (Adizes, 1999)
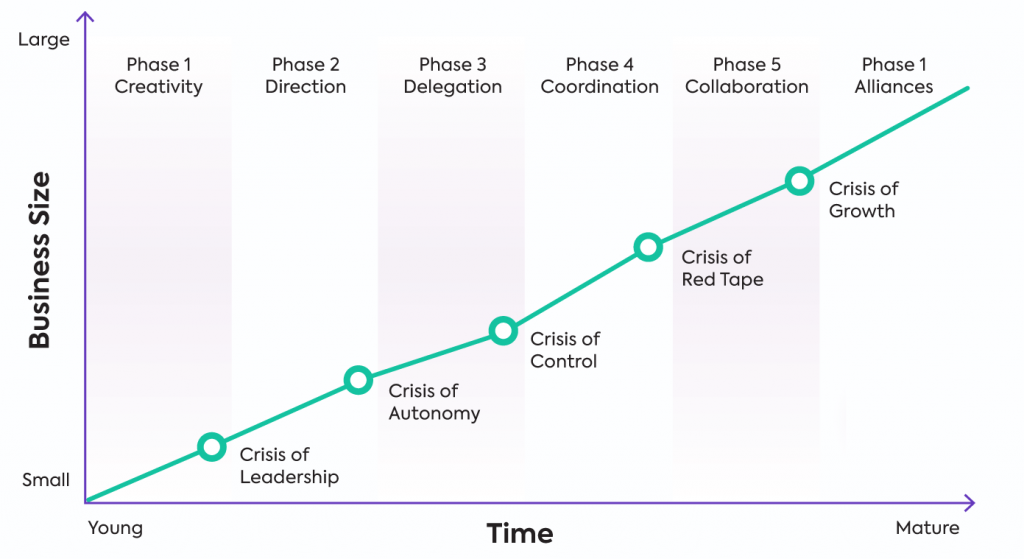
(c) Growth (and crisis) model (Greiner, 1998)
TBNVs (especially in the startup stage of development) are extraordinary difficult to analyse. Unlike public firms, new (and small) private enterprises do not have to publish detailed reports (e.g., employment data, or even turnover or profit if it exists at all during an early growth phase). Moreover, where they do provide information, it is often presented in an unsystematic and obfuscated manner, whereby the ventures frequently exaggerate the extent of their successes and depict an excessively optimistic picture about their future performance. Of course, researchers try to apply indicators that reflect such companies’ dynamics, for example the number of employees, the growth of sales and market share, or the company’s valuation during early series of investments. But these metrics are often very difficult to identify in statistically useful quantities, and for early-stage ventures it is often completely impossible: due to their age, they simply do not have the requisite history of development. Thus, for outside observers, startups are often ‘black boxes’ whose progress is extremely difficult to assess due to a lack of empirical data.
In a paper recently published by the authors, we propose and explore a new metric: Google Trends search-query data. This tool, introduced by Google in 2006, provides statistics on popular search queries from the year 2004 and, as we show in the above-linked paper, this data can be used as a proxy measure of growth in the absence of typically non-public metrics like sales, employee, and market share growth. Why? Put simply, as the internet becomes more and more omnipresent, the norm is increasingly for people to search products and services on Google prior to purchasing (whether online of offline). Because of this, billions of unique and powerful digital traces are created every single day. Once aggregated by search engines, they offer deep insight into customers’ interests and intentions at identifiable points in time and geographical location. This results in Google Trends data being fruitfully used in more than 700 academic studies across various fields, from medicine to economics, and has by now demonstrated significant benefits as a credible scientific tool.
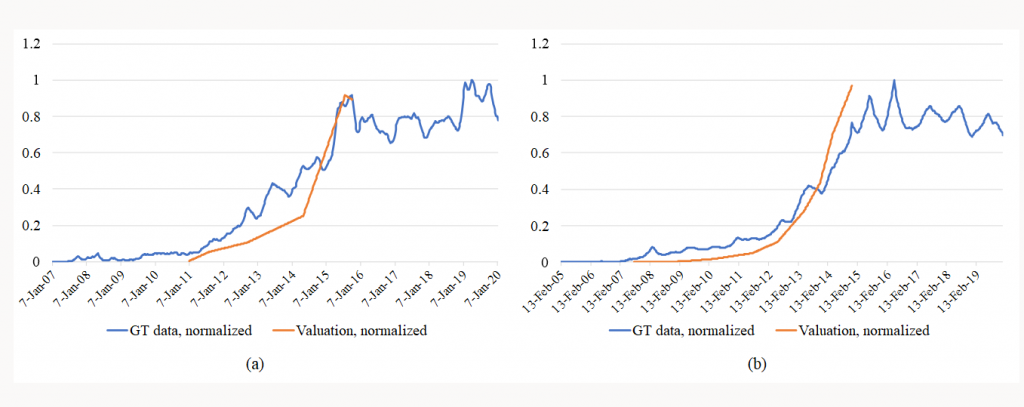
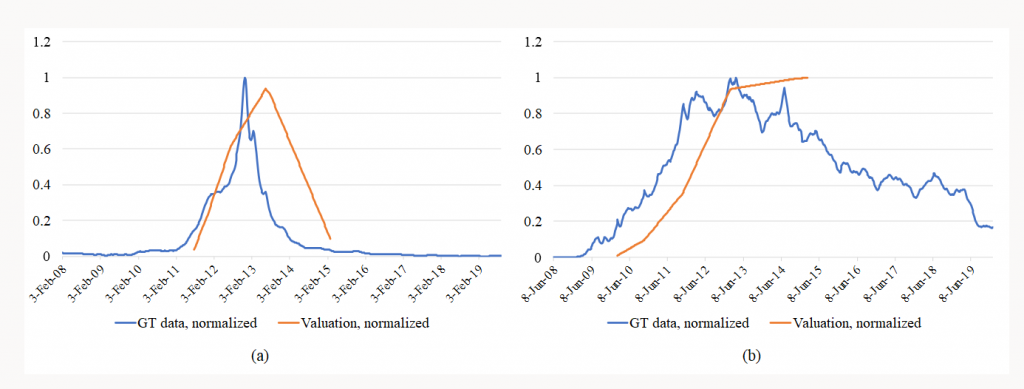
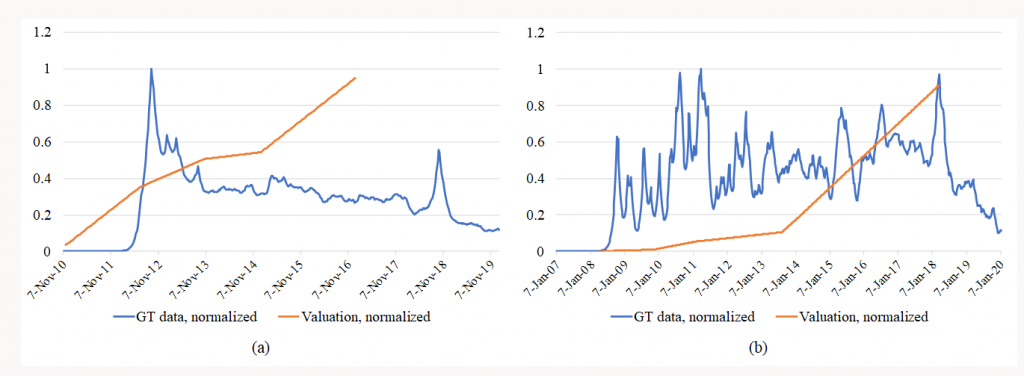
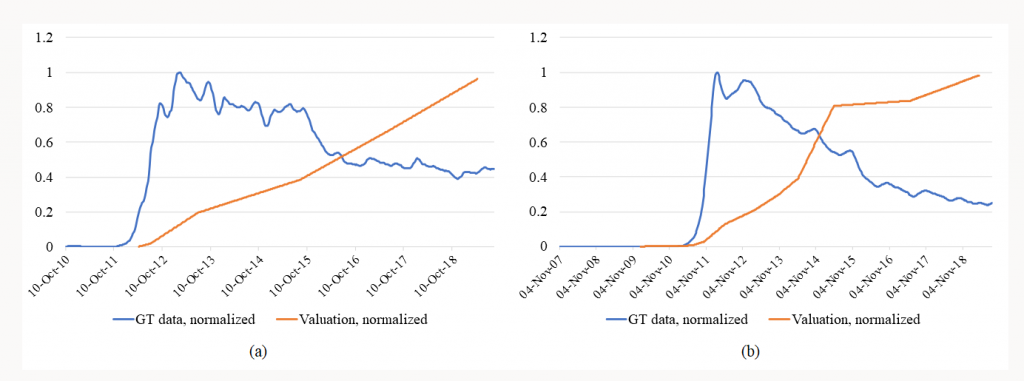
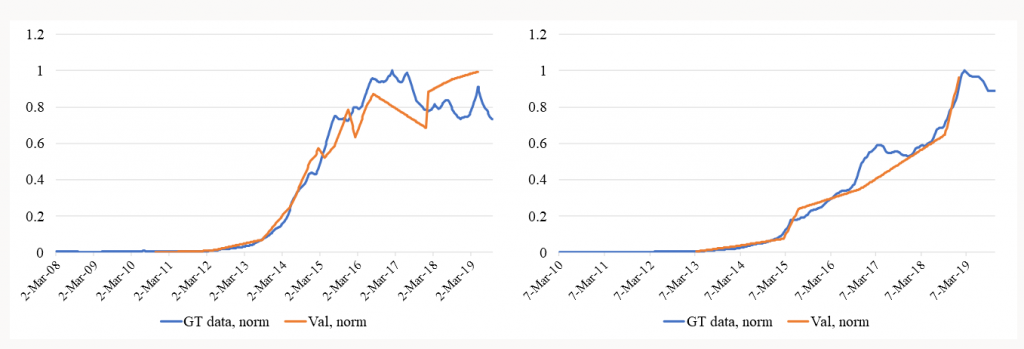
We have shown that there is a direct and reasonably strong relationship between a new venture’s statistics on search queries on the one hand, and its assessment at different stages of investment (valuation) on the other. We collected Google Trends and valuation data for more than 200 new US TNBVs and calculated correlation levels accounting for a possible time shift (i.e., when both time series have similar growth trajectories but started at various time points). The results were divided into three groups: G1 – strong link, without a shift (See Fig. 2), G2 – strong link, with a time shift (See Fig. 3), and G3 – weak link (See Fig. 4).
The multidimensional analysis of achieved correlations demonstrated that:
1. Web search traffic generally correlates well with companies’ growth dynamics. Indeed, the majority of TBNVs from the sample – 83% – show a strong correlation (Kendall’s tau ≥0.5) with and without time shifts. Average and median values of the correlation coefficient for the entire sample are significantly shifted towards the greater values: the obtained sample correlations tend to be approx. 25% higher than 0.5 (See Fig. 5).
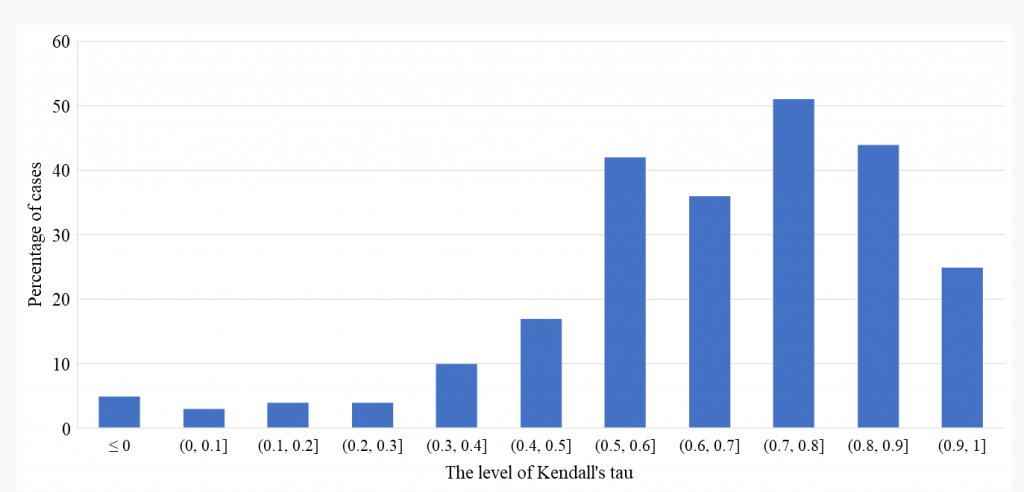
Fig. 5. Distribution of the correlation coefficient across the sample
2. The correlation between web search traffic and TBNV growth dynamics is stronger a) when ventures are more successful in attracting venture capital, especially for the most successful companies, labelled as ‘unicorns’; b) when companies’ customers are individuals, i.e., Business to Consumer (B2C); and c) when companies’ products are in the form of digital platforms. Configurational analysis concludes that the increased likelihood of observing the stronger correlations are for companies that can either be labelled ‘unicorns’ or ‘B2C-oriented digital platforms’.

Take-home messages
The results suggest that for the most successful companies (‘unicorns’) and consumer-oriented digital platforms (i.e., B2C digital platform companies), our proposed approach is an effective yet cheap, simple, and non-invasive method to help provide insights into what is going on inside a TNBV during its early growth phases. For instance, TBNVs’ Google Trends data may be valuable for a better understanding of marketing strategies and business models, intellectual property management practices used in TBNVs, and assessing the results of applying these practices. This might particularly be the case in understanding product-market fit or business model validation, which still lack appropriate tools for a full explanation.
In addition, the methodology of using Google Trends data for analysing the growth dynamics of a particular venture can be slightly modified and applied for growth prediction purposes. Since Google Trends data is comprehensive (time series can be presented even at the scale of minutes) and since we can demonstrate its correlation with companies’ valuation dynamics, we expect that it can serve as a basis for building company-related mathematical models of evolution and future growth (or decline).
Considering the implications for practice, these findings add value by verifying this additional data resource that venture capitalists may employ, supplementing existing sources and methods, as part of investment decision-making processes. By proposing the use of an objective source of data with a description of use, our research can provide meaningful benefits in identifying potential market leaders as well as decreasing information asymmetry and risk. Last but not least, our approach may be advantageous for government policymakers who develop various programs aimed to support new technology-based ventures on the regional and national levels. Big-data driven and accurately targeted backing for entrepreneurial endeavours will increase the effectiveness of these programs and result in the emergence of new knowledge-intensive job places.
This post is based on the paper, “The value of big data for analyzing growth dynamics of technology-based new ventures” by Maksim Malyy, Zeljko Tekic and Tatiana Podladchikova, Technological Forecasting and Social Change (2021)
*****
This post represents the views of the authors and not those of the GILD blog, nor the LSE.
Maksim Malyy is Ph.D. student at the Skolkovo Institute of Science and Technology, Center for Entrepreneurship and Innovation
Zeljko Tekic is Associate Professor at the Higher School of Economics, Graduate School of Business
Tatiana Podladchikova is Assistant Professor at the Skolkovo Institute of Science and Technology, Space Center
—