
 Do government cut-backs lead to greater levels of social unrest? Hans-Joachim Voth and Jacopo Ponticelli have analysed 90 years worth of data for 26 European countries and found an unambiguous message- the more governments cut, the greater the levels of social unrest.
Many incidents can lead to an eruption of violence – from the killing of Mark Duggan in London last Saturday to a high-speed pursuit gone wrong (in the case of the Rodney King riots in LA in 1992). This begs the question: why are urban areas at some points in time like tinderboxes? Why does it only take one act of police brutality for riots to erupt?
We have analysed this question for 26 European countries for the period 1919-2009. We looked at instability in a number of dimensions, from the relatively mild to the deadly serious – demonstrations, riots, general strikes, political assassinations, and attempts at revolutionary overthrow of the established order. Ninety years of data send an unambiguous message – the more governments cut back, the greater the chances of social unrest. Of course, not every rioter or looter in the streets is merely trying to make a public statement against coalition cuts., but the chances of things going wrong in a spectacular way increase as the fiscal conditions change. Once cuts go above 2 percent of GDP, a major surge in the frequency of destabilizing incidents can be expected.
The same is not true for tax increases (the UK’s experience with the poll tax not withstanding). While there are cases of unrest when taxes are raised, the effect is mild, and could even be down to chance. The reason is that most of the time, taxes are levied on people whose opportunity cost of rioting is high. Cuts, on the other hand, fall disproportionately on those for whom trouble-making is a low-cost affair.
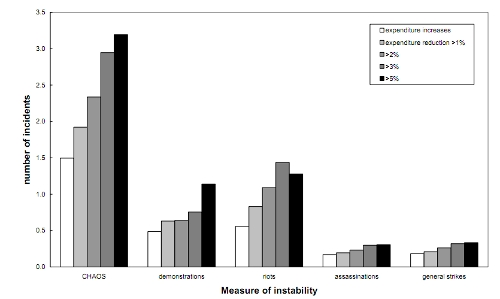
Figure 1 shows our main result. The darker the bars, the larger the budget cuts (as a percentage of GDP) and the higher the level of unrest. This relationship holds when we add up all indicators of instability (CHAOS), and in each subcategory (CHAOS is the sum of demonstrations, riots, strikes, assassinations, and attempted revolutions in a single year in each country).
When expenditure is increasing, the average country-year unit of observation in our data registers less than 1.5 events. When expenditure cuts reach 1per cent or more of GDP, this grows to nearly 2 events, a relative increase by almost a third compared to the periods of budget expansion. As cuts intensify, the frequency of disturbances rises. Once austerity measures involve expenditure reductions by 5per cent or more, there are more than 3 events per year and country — twice as many as in times of expenditure increases. Most of the increase in unrest is driven by more riots and more demonstrations.
Figure 1: Unrest and budget cuts
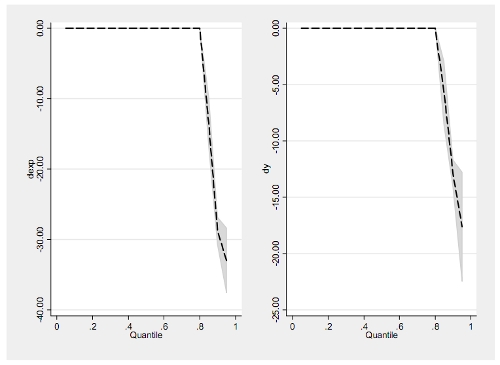
The effect is not simply driven by hard times. When growth dips, unrest becomes more common – but austerity makes it much worse. The pattern we find still holds when we filter out the effects of the business cycle. Interestingly, the higher the level of instability, the greater the role of budget cuts. Over the last century, the worst periods of unrest (indicated by quantiles above .6 in the chart) coincided with budget cuts (Figure 2).
Figure 2: Quantile Regression Plot, Effect of Expenditure Changes (left) and GDP Growth (right) on the number of incidents
Cuts can have an effect even before they are implemented. Earlier studies analysing high-frequency data found that unrest peaks before the implementation of budget measures, and declines thereafter. This suggests that there is an element of “negotiations on the street” to social unrest, with some success in influencing policy. In line with this, countries that have more unrest are also more indebted.
What are the implications for the UK? Interestingly, the UK has a higher frequency of incidents than the average– 3.5 per year, as compared to 1.5. It has also reacted more strongly to cuts over the last 90 years. While expenditure cuts by one percentage point of GDP typically increased unrest by 0.4 incidents per year and country, in the UK, the increase was three times as large – 1.2 incidents per year.
Unrest can lead governments to change their minds in a hurry. In the summer of 1931, Britain was also in the middle of implementing many austerity measures. Just as EU governments are doing today, these were designed to keep the markets’ trust in the UK government’s commitment to a fixed exchange rate alive. Back then, it was the gold standard. Today, it’s EMU. Amongst the measures implemented were pay cuts of up to 25 per cent for the Royal Navy. In September, when battleships of the fleet arrived in Invergordon, in Scotland, sailors learned of the cuts and mutinied. A week later, with a bit of help from the markets in the form of speculative pressures, the UK had left the gold standard, without even raising the discount rate to crisis levels.
Nobody knows what the future will bring. History does not repeat itself, but, in the words of Mark Twain, it rhymes. If past experience is anything to go by, the UK should brace itself for many more incidents like the riots of this week – and the rest of Europe should prepare for reruns of events in Athens.
Please read our comments policy before posting.