
 Accusations of BBC media bias have flowed thick and fast from right and left, but the real scandal of the 2019 Election Night was that seats projections were announced at 10pm, the exit poll vote shares were only made public briefly (in ‘footnote to history’ fashion) 30 minutes later, while meaningful discussion on the parties’ national vote shares came only seven hours later, when almost all viewers had gone to bed. Pippa Norris and Patrick Dunleavy argue that focusing solely on seats (and power) formed the centrepiece of a thoroughly over-legitimizing representation of the UK’s election process, exaggerating the Conservative and SNP victories, overstating Labour’s poor performance, and ignoring the injustices meted out to the Liberal Democrats (who greatly increased their votes), Greens and others. A simple re-framing could easily combat the BBC’s and other broadcasters’ now firmly enrooted ‘bias against understanding’, entailing something of a move back to older and more accurate election night formats.
The main lines of British political culture over the next four and a half years were constituted by the election of 12 December, and by how the broadcasters, especially the BBC, represented the results overnight. Election night coverage remains one of the few ‘water cooler’ events in public service television. BBC One’s election night program peaked at 6.1 million viewers as the results of the exit poll were announced at 10pm. It drew in around 4.36 million on average from 9:55pm to 2am, with many others watching the BBC online. Millions more people were tuned to ITV, Sky and Chanel 4.
The centrepiece of election night programming across all broadcast channels was the single Exit Poll, conducted in 144 polling stations, with voters recasting their ballots anonymously for Ipsos MORI. From the change in votes since last time (at the self-same sites) an army of skilled analysts then dissects the new results to predict the overall seat outcomes for the BBC, ITV and Sky. ‘The principal aim of the exit poll’, said John Curtice the BBC guru in overall charge, ‘is to help viewers and listeners to navigate the initial hours of election night as the first results come in. By comparing the actual results with the forecast of the exit poll, we will be able to point to the political direction in which Britain is now apparently headed’.
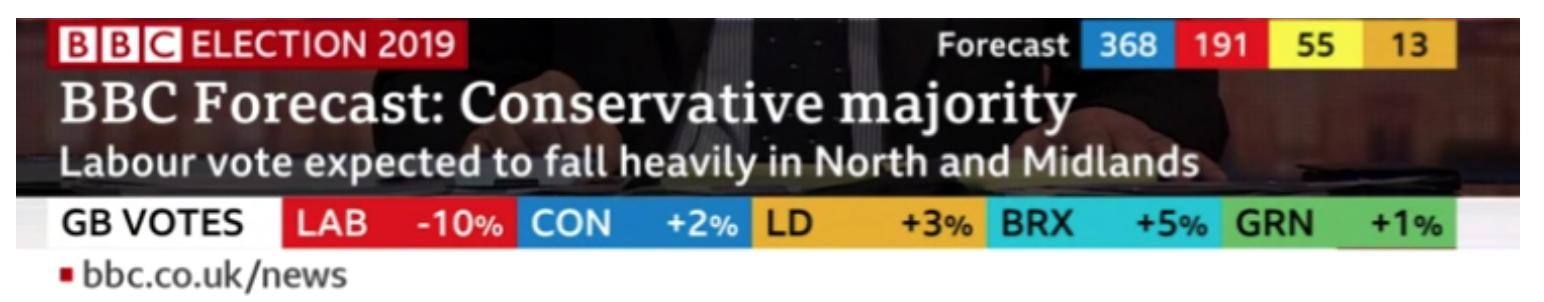
In the event, the 2019 poll correctly predicted 368 Tory MPs (actual number 365), 191 for Labour (actual 203), 55 for the SNP (in fact they only won 48 of Scotland’s 59 seats, a major gaffe for the analysis here), and the Liberal Democrats 13 (actual 11). This precise prediction more or less eliminated all other perceptions, and incessantly dominated all further analysis and discussion for the first many hours of programming. A dominant narrative was established, with no effective counter-notes of any kind, proclaiming a Tory triumph, Labour wiped out in a historic defeat (widely represented as paralled only by Michael Foot in 1983), and an (as it turns out, overstated) SNP hegemony north of the border
The national vote share percentages from the Exit Poll were not quoted onscreen for half an hour, during which the dominant narrative in terms of seats and power was firmly established. It then emerged very briefly at 10:25pm that the Exit Poll rated Tory support at 46% and Labour at 32%, while a page on Sky News website gave other details. However, these vote share estimates did not form part of the running coverage. Instead, the BBC shifted over to showing a banner based on actual votes from the results announced so far. For the rest of the night, this alternated with the forecast seat numbers. Here is the display at 1 hour and 35 minutes into the show after the Blyth result was announced.

Despite the “GB votes” label, these are not vote shares but only vote change numbers (slightly misleadingly called % instead of a percentage point increases). As this example shows, with no start point provided to viewers these numbers were useless early on – notice the Labour share down 13 percentage points here and the Brexit vote share up 11 percentage points.
Of course, health warnings were given orally about this representation, but this way of giving information was not altered, although it did not help voters understand what national vote shares were. Even around four hours into Election Night, the alternating ‘GB votes’ display was not a lot of use to anyone – note the Brexit vote share rated up 5% and Labour’s decline still over-stated.
Constituency vote swings were occasionally highlighted, but without any background template and only then mainly in seats which experienced a particularly dramatic (and usually untypical) change. The narrative became a dramatic and exciting landslide of seats for Johnson – and the historic defeat of Labour MPs.
Only after 5am did the BBC’s Jeremy Vine at last prominently announce an estimated three-party national vote share for Britain, to a residual audience of insomniacs and election geeks.

And what a different story this told. Despite the Brexit Party standing down in their favour, the Conservative UK vote share increased by just 1.2% on their 2017 performance. And Labour’s 32.1% share of the UK vote under Corbyn was not historically poor, exceeding as it did Ed Miliband’s in 2015 (30.4%); Gordon Brown’s performance in 2010 (29.0%), or Neil Kinnock’s vote share in 1987 (30.8%). Indeed the 2019 Labour vote was just a couple of points behind their average performance since February 1974, when multiparty competition started to reduce the average two-party share of the vote. Labour’s vote share was down sharply on 2017 (-7.8%), driven by supply-side patterns of party competition which split the Remain camp. The Liberal Democrats under Jo Swinson had actually achieved a near 50% increase in their vote share, despite winning only two handfuls of seats. The divisions amongst the UK’s clear majority of the Remain voters were exacerbated by the UK’s electorally disproportional First-Past-the-Post electoral system. It returned to its typical form in 2019, vesting Boris Johnson with 13% more seats than his national vote share, and awarding four fifths of the Scottish seats to the SNP for 45% of votes there. There was no vast blue tsunami in the grassroots British electorate. Different choices on the ballot simply altered party fortunes, which the electoral system then reshaped and exaggerated.
Why did the broadcasters vest all their national analysis in the Exit Poll, an exercise which since methods were changed in recent years has not been primarily designed to generate an accurate estimate of the national vote share? Why was the exit poll vote share not compared with the plenty of reputable national polls conducted very close to the election day itself – which gave a vote share that later turned out to be pretty much spot on, as Figure 1 shows? Any political scientist could have told the BBC that the median result here was highly likely to be accurate on national vote share. And while the BBC had a self-denying ordinance of not really covering polls during the campaign, that all ended at 10pm on election night.
Figure 1: Vote shares (%) in the actual 2019 result and the last seven opinion polls
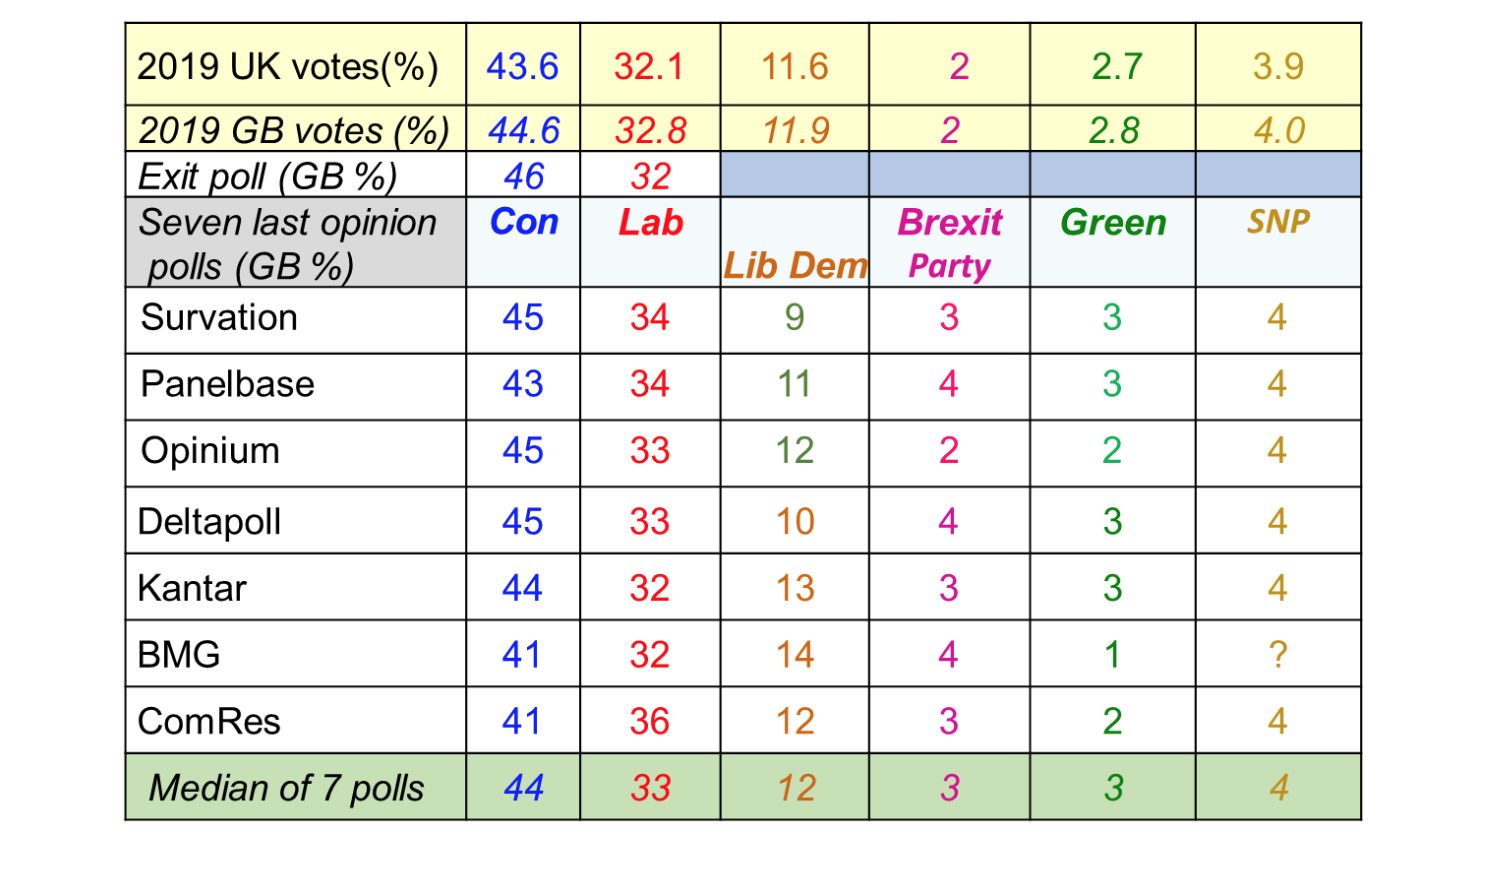 So, accurate vote share information was there for journalists and commentators to consider – it just could not be managed within the dominance of the Exit Poll ‘frame’ – with its implied claim that only seats outcomes count, that only what determines the immediate contours of power in Westminster matters, and that the UK’s biased electoral system in fact accurately captures the ‘will of the people’.
For the BBC especially, the 2019 election night was a conspicuous failure of the Reithian mission to educate and inform citizens at a critical juncture in political life in an open and multi-variant way. It ‘help[ed] viewers and listeners to navigate the initial hours of election night’ only in a one-sided, “only power matters” kind of way. Ironically this was a complete denial of the BBC’s valuable Election Night heritage. In the old days of David Butler and Robert McKenzie’s ‘swingometer’, changes in the national share of the votes provided a key focus of discussion and debate across the first hours of every election night. It filled the ‘empty hours’ while the seats results trickled in, and accurately located viewers in an overall view of votes and seats within the electoral process. A careful analysis of how voters actually cast their ballots nationally also celebrated citizens’ collective judgment, and then allowed citizens to better appreciate how vote national shares became converted to seats. By 2019, all this was long gone. The fancy graphics were all about seats, and all discussion focused on what seats alone implied about political power and future policy.
Journalistic framing conventions largely defined the seats-only Exit Poll perspective of the BBC and of other channels. Perceptions like these largely determine what is covered as newsworthy in public affairs. Frames reflect organized structural conventions in newsrooms, not individual choices or biases by reporters. Independent international media watchdogs have rated BBC news highly for their factual reporting, although perhaps slightly favouring the left in their news story selection. The Loughborough University content analysis of 2019 campaign news coverage, found a rough parity in coverage of the two major parties, but around two-thirds of TV news focusing on the Conservative and Labour campaigns. Nevertheless, the Liberal Democrats and SNP were given more attention on TV news than in the printed press – although that is hardly a level playing field comparison.
Appreciating framing bias
A different frame would have been possible if the interpretative frames used by broadcast journalists were only just a little bit more prepared to ‘speak truth to power’. Here is how national vote shares could have been introduced, from the outset of the Election Night broadcast, based on a better-rounded Exit Poll (taken together with well-conducted national opinion polls) – at the same time as the mature seats projections were announced:
The Conservatives came out top convincingly, gaining their largest parliamentary majority (80 seats) since 1987. Yet their share of all votes under Boris Johnson was 43.6%, up by one percentage point from two years ago under Theresa May.
Under Jeremy Corbyn, Labour’s vote fell back from 40% in 2017 to 32%, a steep decline which saw the party’s MPs fall back towards 200. Yet its vote share was just 3 percentage points below the party’s average performance under successive leaders for the last half century. And Corbyn won a higher vote share than Gordon Brown in 2010, or Ed Miliband in 2015.
The biggest vote gain of the night went to the Scottish National Party, up over 8 percentage points to 45% of all votes in Scotland. Against a fragmented opposition, the party gained 48 (80%) of the 59 seats in Scotland under the Westminster election system.
Elsewhere the Liberal Democrats also grew their support by 4 percentage points, reflecting a surge of support from their clear Remain stance. Under Jo Swinson the party achieved their best share of the vote since 2010, but won only 11 seats.
The two parties advocating a hard Leave position towards Brexit were marginalized. The Brexit Party under Farage gained 2% of the overall UK vote, and UKIP just 0.1% support – a dramatic change since the Brexit Party won a 33% vote share in the May 2019 European elections.
Overall, reflecting the public’s position towards Brexit shown in recent opinion polls, the Leave parties won a combined share of the GB vote of 47%, compared with 53% for the Remain/2nd Referendum camp.
By contrast, here is the BBC’s actual final overall summary of the night’s outcome (focusing only on seats, and still ending with a salient exit poll mis-prediction of historically unprecedented poor Labour performance):
Boris Johnson will return to Downing Street with a big majority after the Conservatives swept aside Labour in its traditional heartlands.
With just a handful of seats left to declare in the general election, the BBC forecasts a Tory majority of 78.
The prime minister said it would give him a mandate to “get Brexit done” and take the UK out of the EU next month.
Jeremy Corbyn said Labour had a “very disappointing night” and he would not fight a future election.
The BBC forecast suggests the Tories will get 364 MPs, Labour 203, the SNP 48, the Lib Dems 12, Plaid Cymru four, the Greens one, and the Brexit Party none.
That means the Conservatives will have their biggest majority at Westminster since Margaret Thatcher’s 1987 election victory.
Labour, which has lost seats across the North, Midlands and Wales in places which backed Brexit in 2016, is facing its worst defeat since 1935.
__________________
Updated version: We thank all those who commented on an earlier version, and whose inputs are incorporated here.
Pippa Norris (@PippaN15) is the Maguire Lecturer in Comparative Politics at Harvard University and the author of numerous books on British and comparative politics, media politics, and (with Ronald Inglehart), Cultural Backlash (Cambridge University Press 2019).
Patrick Dunleavy (@PJDunleavy) is Professor of Political Science and Public Policy in the Government Department at LSE, and Centenary Professor at the Institute for Governance and Policy Analysis at the University of Canberra. His most recent books are The UK’s Changing Democracy (LSE Press, 2018) [co-edited], which is free to download; The Impact of the Social Sciences (Sage, 2014) [co-authored]; and Growing the Productivity of Government Services (Elgar, 2013) [co-authored].
All articles posted on this blog give the views of the author(s), and not the position of LSE British Politics and Policy, nor of the London School of Economics and Political Science.


Thanks to all the comments, and we appreciate the interest and ideas, no matter how critical.
But it does seem to be a bit like the endless arguments about whether the classic image shows a duck or a rabbit. It shows both. Interpretative frames matter for the same facts.
The blog is simply arguing that if you want to understand power at Westminster, look at the UK share of seats. If you want to understand the mood of the electorate, the mandate for the government, and levels of party support, look at the estimated or actual UK vote share. And you can’t read any if these things directly from simply the seat share, because of the role of the electoral system.
To do otherwise, is to allow an unconscious interpretive horse-race bias to frame the meaning of the election.
This point shouldn’t be remotely contentious; on election night, journalists need to report BOTH measures, not just giving primacy to one or the other. The facts are not in dispute. Let viewers decide for themselves how to understand the information. The BBC used to do so for more than six decades. Why not now?
I agree Pipoa.
Its pretty straightforward.
I guess you “won the argument”
The thought that the framing of the exit poll during the night of the election was incorrect is totally barmy.
It doesn’t matter how you spin it Labour got spanked. The predicted seat total for the Conservative party was 3 too many, with Labour’s being 12 short. – In the great scheme if things a mere bagatelle.
The authors have concentrated their article on vote share and yet have failed to mention the most remarkable fact of all, namely that the Conservatives have now increased their share of the vote in six consecutive General Elections. The authors may be able to enlighten us but I believe this is historically unique in any Western democracy. I suspect it may be contrary to their general narrative, namely that they believe the Conservative’s success is overstated.
The election was rigged for Boris. The elections in Britain are always rigged. Corrupt since Victorian days and before. Analysis of ‘media bias’ is a distraction.
All the polls ‘predicting’ the result are from those conniving in the #votefraud.
Polls are not about garnering our opinions but for dictating them.
This article is a case study in how out of touch academics are not interested in anything that doesn’t confirm their own biases. Prepare for decades of being baffled by the behaviour of you fellow countrymen.
This is the same story I’ve seen the Dems playing in the US and the same errors they made too.
All you are doing is looking at hypothetical results if the rules were changed but the parties and voters were NOT told about the change and behaved as if they were operating under the original (current) rules.
If the popular vote determined the winner, parties would spend money targeting what are currently their opponents safe seats instead of ignoring them. Voters in what were safe seats and so didn’t bother voting would also come out in force.
The rules is the rules. Change them and the votes will change including the 32.1% who voted Labour. Many people voted tactically for them (or others) and for other reasons. If you had PR or AV or De Hondt or anything else, this would change, so I don’t see the point of the article.
Btw, does any one know why it is called ‘first past the post’? To start with, there is no post and secondly no-one goes past this (non-existant) post anyway. The candidate with most votes wins. End of.
FPTP is the way our election system seems to work the best and it’s not going to change anytime soon so there’s really no point in speculating about how the Tories won and why they did. PR would just add chaos to the system as it has done here and in countries with such a system as it just leads to paralysis as we have witnessed. Let’s just see what the future holds.
Oh seriously, to “academics” from two very left wing, liberal (ha, ha) Universities who can’t stand the fact that their damaging politics doesn’t suit the plebiscites anymore, want to dismantle our voting system and bring in p.r. What a stupid idea, we’ve just had to put up with a hung parliament, and previously a consensus government, and look where that got us. P.r. governments paralysis countries, and lead to some very dodgy election results, the last ones in Holland and France being two of interest.
Anyone with half a brain,has long ago leant to pick their any reports on t.v.on all stations.remember most tv reporters are trained by BBC.Having of course been to the right school and the right universities.
I may have inadvertently pasted another comment: of no matter.
Here is what I have published on ‘my’ fb page in respect of this blog article and its associated comments and had intended to offer, here:
Geraint Day thanks!
This is, both, a useful article and a refreshingly modest set of responses.
Yes, the authors, in all probability, show their preference (Labour, Remain) but the responses provide useful set of responses.
I recommend the very helpful, long response from Hon Wei.
For the record: I don’t have a television (nor does one have me!). I don’t want a good night’s sleep ruined by the depression of yet another Labour defeat or the false elation of another Labour win. It’s what happens subsequently that matters.
I take the view, always, that every defeat is a win: it gets that offer out of the way, while every win by Labour (from our Town Council win in Hertfors in 1995, when I was one of the Labour Councillors elected, as a majority group, was the start, not the end.
Just as is this election result: Labour, as defined for the present, lost.
How Labour (and its sister Party, The Co-operative Party, which has been entirely ignored in this article, all of the comments, and all other commentaries, it seems: despite having thirty-or so Labour and Co-operative MPs and, quite likely, as before, the third-largest MP Group, by Party membership) responds is, as I said, above, the key issue post-election Day (and Night!).
I hope this helps.
And my thanks, again to my friend and fellow Co-operator, Geraint Day for indicating this blog article to me.
I encourage all Branch Labour Parties to ask their CLPs to request that the Parloamentary Party (cc John and Jeremy for democracy’s sake!) to use our Opposition Day debating time to propose the adoption and implementation of the living plan for tue democratic and Co-operative Socialism.
Please ask your local Co-operative Parties, Trades’ Councils, Peace Councils and Retired Trade Union Pensioners’ Action Associations to do likewise.
And please inform your local Woodraft Folk and XR Groups to write likewise.
Thank-you!
For peace,
Through
The authors seem to ignore the historic impact of Labour losing seats in the Red Wall of the North.
We have a very unbalanced system that favours the Conservatives. Finally labour leadership candidates are talking of electoral reform.
You could argue that the BBC should highlight the actual vote and hence show the public the unrepresentative nature of FPTP. Or you could say reality is reality and the exit poll is an early and fairly reliable indicator of election outcome.
You are correct that the Labour defeat has been spun as a national repudiation of the left’s policies. Reality is Labour has been defeated under centre-right, center, centre-left and left platforms – with the best performance under the centre-left manifesto of 2017.
Once the point is made that FPTP is unrepresentative what’s next? How do we gain power and fix the inherent bias?
Thank you for an excellent analysis, I very much agree. Speaking as a Green I am very weary of how media discourse frames constantly marginalise our viewpoints and support. Keep up the good work!
For the BBC to have reported this as anything other than a drubbing for Labour would have been disingenuous. They focus on seats won for a good reason – our system is a non proportional one. Losing heavily and giving the Conservatives the seats to form government for the 4th consecutive time is a significant rejection of Mr Corbyn and his ilk. To deny this is to risk perpetuating this entryist incursion into the party.
A respondent above writes:
” I have always found the old style swingometer to be quite misleading, as it is one dimensional and computes the “swing” as the sum (or half of the sum) of the absolute change in vote shares won by the largest two parties, ignoring changes in other parties.”
The swingometer was entertaining in its day (even more so when Peter Snow was presenting the statistics and waving his arms about) but as HonWai writes, it wasn’t that useful. It wasn’t understood by us in the old BBC back-and-white TV days that the ‘swing’ is half of the absolute change in votes and that it ignored third and fourth party effects. With three- (or in Scotland sometimes four-) way marginals the ‘swing’ meant nothing.
Much more useful data is now projected on the screen than the ‘swing’. Of course some of it is rather absurd, especially when Jeremy Vine is walking about gesturing up ‘projections’.
Sir John Curtice said when the Exit Poll was first announced that the projection for the SNP looked unreliable, and that very few polling stations in Scotland had exit-poll surveys at them. And so it proved. One might note that the LibDems ended up with 4 seats in Scotland, the same number as they won in 2017. The palaver about Jo Swinson losing her seat obscured that the LibDems won back NE Fife from the SNP (Malcolm Bruce’s old seat, includes St Andrews). They held Edinburgh West (Corstorphine and Murrayfield area).
So what you are saying is that Corbyn won?
Enough sour grapes to knock out a year’s supply of cheap wine to keep a medium sized country happy. Give it up, it’s almost beyond parody. You lost. As per the way democracy works in the UK. Get over it and try not to cry “foul” for the next full 5 years please. It’s been bad enough listening to the wailings since Brexit. Pathetic…
FPTP is rubbish! Internal party selection, EU parliament, Scottish parliament etc seem to get on just fine with PR. Of course I would prefer STV over a member list system but nevertheless, the GE is the only election event where I live in Scotland where I feel like my vote might be wasted.
Extraordinary. Remainers still arguing that really they won and it’s all very, very unfair. We have had a vote on proportional representation, and the vote was in favour of first past the post.
Poor analysis. The system is constituency based, not share-of-national-vote based. This fact influences voter behaviour. For example, I vote differently in the constituency I live in now than I did a few years ago even though my political opinions remain much the same. The loss of many formerly rock solid Labour seats to Conservatives was unprecedented and showed a major shift on the part of a large section of the electorate that this anysis doesn’t even bother to mention. I think the academics are more biased than the broadcasters.
I may be bothered if Labour had backed PR in 2011. They didn’t so they don’t really have any right to call foul over reporting of voting shares. They were totally happy to support the current voting system then and frankly can’t really complain now. And frankly the last thing they need is to kid themselves they did well by using stats this way.
Same old moaning by the Remain elite, we are going to have Brexit so let’s try and call a foul.
The exit poll was used in this way as it was the ONLY poll that got it right in 2017, so heavily used again.
It was right again. No more story needed.
As for saying “Scotland…major gaff for the analysis” obviously not paying attention to John Curtice when he told us , shortly after 10pm, that the polling in Scotland was open to variation as the geography had limited the sampling.
My horse came second, but nobody was watching how elegantly it was striding, boo hoo!
(Outsider View!) The narration was indeed on the seat-change, which is a complete shamble, but expectable with the first-past-the-post-system. The vote percentages and change in vote percentages where on the bottom of the screen every twenty seconds. I was watching a rather simple election coverage, without much fanfare, rather flat.
You’ve count yourself lucky with such a broadcaster. No commercials, lots of OB’s, mostly neutral. It’s so big, there is always a opportunity to criticise, but be careful, before long it won’t be there in the way it’s now. Look at the Netherlands, France and to a lesser extent Belgium.
Of course, on this point, overstating the labour loss is maybe truth, but losing the number (and kind) of seats was breathtaking.
One big advantage: The UK is not without a government for months on end, which is what happens with the negotiations between party’s, sometimes for months on end. You’ve mostly a clear and decisive result.
The vote shares are of secondary importance on election night. Seats determine parliament and therefore government.
Broadcasters take the risk of going with the exit poll analysis. This year as the past few they were broadly correct.
An interesting article but you finish it feeling that the authors have a bias! The manner of reporting the results is based on the current voting system. I seem to remember vote share being covered to some degree at least but it is not what determines power in our system so is an academic issue.
I see youve poked a hornets nest of those ignoring the future.. The results are being interpreted as Labour is wiped out, Corbyns policies are wiped out, Left wing socialism Is wiped out. Therefore the exit poll onwards was a battle for the change of tack for Labour. We are viewing this campaign daily with ridiculous calls from Blair, Kinnock senior, Milibands (losing brother one and two). Just as you points to Mays healthy share of the vote, in 2017,you point to Corbyns Labour losing on the brexit issue only.
Firstly, it’s seats that matter, so it’s seats that are the focus. Naturally.
Secondly, if it was overall % of votes that mattered, the parties would campaign differently, and the voters would vote differently. That’s borne out by the results of the Euro elections and the GE – in both cases, the electorate put the Leave Party in charge, under different rules.
The electorate seems to be more sophisticated than these guys think.
You are absolutely right, Cambridge Analytica’s software is very sophisticated.
How is CA relevant?
This commentary rather overlooks the fact that it’s the number of Seats won by a party which determine who forms the government and their ability to pass legislation in Parliament. Unsurprising that the BBC focused on this; even less so given the paralysis that a hung parliament has caused in recent years.
And like it or not, democracy is a relative competition – whoever gets the most votes in each constituency wins. So the absolute vote share is irrelevant to the outcome.
This is not an academic paper. At best it’s an argument for Proportional Representation. At worst, it’s trying to excuse the woeful performance of Jeremy Corbyn and John McDonnell’s socialist Labour Party.
“Only after 5am did the BBC’s Jeremy Vine at last announce an estimated three-party national vote share for Britain, to a residual audience of insomniacs and election geeks. And what a different story this told.”
The tone and narrative of the election coverage did not change after the vote share figures became available in the early morning. Had estimated vote shares been released simultaneously with the exit poll, the subsequent several hours of commentary and reporting would not have presented a different story. The actual vote shares and seats are quite close to the results of the first MRP analysis published on 28th November (https://www.thetimes.co.uk/article/mrp-election-poll-boris-johnson-heads-for-big-majority-qrqsq9f7r), when Tories were projected to win 359 seats, Labour 211, LibDem 13, on 43%, 32%, 14% vote shares respectively. Back then, the November article was already priming the narrative: if the election results are in line with the projections, that “Labour would suffer its second-worst postwar defeat, with Jeremy Corbyn’s total two above Michael Foot’s in 1983.” Although I agree that it would have been helpful if vote share estimates are published as part of the exit poll, I disagree that the time lag would have made any difference to the narrative during the election night. I agree that the FPTP electoral system translates poorly the heterogeneous views of the electorate into seats. But given this is the system the country is stuck with (owing to the failed 2011 referendum to reform the electoral system, and incentive for both major parties to retain the status quo), the media commentary and analysis have to focus on seats, and only pay secondary attention on vote shares – unless the latter give insight into the robustness of seats allocations to small perturbations in vote shares. We saw exactly the same focus in the aftermath of the 2017 election, when virtually all the media commentary and analysis focused on Theresa May’s loss of seats and of her majority, despite her winning the highest vote share by any party since Tony Blair’s 1997 landslide victory – a fact barely mentioned in the media.
“For the BBC especially, the 2019 election night was a gross failure of the Reithian mission to educate and inform citizens… this was a complete denial of the BBC’s valuable Election Night heritage – for in the old days of David Butler and Robert McKenzie’s ‘swingometer’, changes in the national share of the votes provided a key focus of discussion and debate across the first hours of every election night.”
The BBC election coverage this year is neither more nor less informative than the previous 2 elections. I have always found the old style swingometer to be quite misleading, as it is one dimensional and computes the “swing” as the sum (or half of the sum) of the absolute change in vote shares won by the largest two parties, ignoring changes in other parties. In this election, in the Red Wall constituencies, the relative changes for Labour, Conservatives, Brexit Party and (to a lesser extent) LibDems are of great importance in understanding how Labour lost seats held for decades, or as much as a century. In my view, the BBC graphics showed the relative changes for all the parties fairly informatively, and BBC provided adequate commentary on how double digit drops in Labour vote shares are matched by corresponding rise in votes for Conservative and Brexit Party.
“Independent international media watchdogs have rated BBC news highly for their factual reporting, although perhaps slightly favouring the left in their news story selection.”
The direction of media bias is often in the eye of the beholder. Momentum activists berated BBC for anti-Corbyn and rightwing bias (e.g. Laura Kuenssberg was regularly heckled by Labour activists, especially back in 2016 & 2017). At the same time, Conservatives and rightwing media lambaste BBC for liberal bias. For example, writing in the Times, Trevor Phillips, former chairman of the Equality and Human Rights Commission, warned that the BBC “is in peril unless it ditches its liberal basis” (https://www.thetimes.co.uk/edition/comment/the-bbc-should-stop-digging-its-own-grave-0cjpqt3pj). Andrew Marr’s interview with Johnson in December attracted twelve thousand complaints (https://www.bbc.co.uk/news/entertainment-arts-50778240), primarily criticising Marr for repeatedly interrupting and talking over Johnson. The most glaring incident of anti-Tory bias, whether deliberate or inadvertent (e.g. due to poor screening procedures of the audience, perhaps Labour activists regularly pose as Tory supporters; this problem can be addressed by screening audience using more sophisticated questionnaire, based on attitudes to a set of policy issues), was the Question Time session the day after the Tories won a landslide, yet virtually no one in the audience voted Tory when Fiona Bruce asked for a show of hands.
“Labour’s vote share was down sharply on 2017 (-7.8%), driven by supply-side patterns of party competition which split the Remain camp.”
We have to wait for post-election surveys to determine the sources of the 7.8% drop. The YouGov poll completed on 6th December showed vote shares of 43%, 33%, 13%, 3%, 4%, 3% for Conservative, Labour, LibDem, Brexit Party, SNP and Green respectively (https://d25d2506sfb94s.cloudfront.net/cumulus_uploads/document/itsi0h01ub/TheSundayTimes_VI_Results_191206_w.pdf).
The numbers are quite close to the election results, including the projected fall in Labour vote, which is attributed to loss of 4.4% to pro-Brexit parties (Conservative + Brexit Party), loss of 6.4% to Remain parties, gain of 1.7% from pro-Brexit parties, gain of 1.2% from Remain parties. Hence the loss of Labour votes is due to net loss to pro-Brexit parties of -2.7%, and net loss to Remain parties of -5.2%.
That is, Labour suffered loss to both pro-Brexit parties and Remain parties by ratio of 1:2.
From this angle, assuming that Labour’s defeat is primarily due to Brexit ignoring leadership and manifesto effects, one could argue Labour’s vote share was down largely due to the split in the Remain camp, though it also lost to the Leave camp. However, none of these figures give a clear picture to why Labour lost so many seats. One needs to analyse the shifts in vote shares in the former Red Wall seats. Most certainly, the reason for loss of so many seats has nothing to do with split in the Remain camp.
“There was no vast blue tsunami in the grassroots British electorate.”
This is correct at the national level. However, it is most certainly false in the former Red Wall seats, if we also count Brexit Party as blue. What would be really illuminating is to figure out, at a national level, how much of the Tory & Labour votes are due to ardent supporters versus reluctant voters choosing the lesser of two evils. It would also be illuminating to figure out a way to estimate how many of the Labour seats lost to Tory would have stayed red and how many more Labour seats retained by the party would have been lost to Tory had Farage withdrawn all candidates.
“Yet their share of all votes under Boris Johnson was 43.6%, up by one percentage point from two years ago under Theresa May.”
Without further qualifications, this observation is misleading. Although her early election strategy backfired spectacularly, Theresa May’s vote share in 2017 was the highest won by any party since Tony Blair’s 1997 landslide victory. It is surely noteworthy to point out that Johnson’s 43.6% is highest won by any party since Thatcher’s 43.9% in 1979, and exceeds Blair’s 1997 vote share. The lesson I take from these observations is that even when seats are viewed alongside vote shares, it is difficult to gauge the mood of the electorate. One has to take into account approval ratings of the party leaders, as well as qualitatively feedback from surveys, and anecdotal evidence collated by grassroots activists knocking on doors during the campaign. The evidence suggests a good portion of Tory and Labour voters cast their vote without much enthusiasm, viewing the contest as a choice between the better of two bad lots.
Although Corbyn won a higher vote share than Gordon Brown in 2010 or Ed Miliband in 2015, Corbyn’s approval rating was way lower than that of either Labour leaders in the final weeks of election campaigns. Corbyn averaged minus 40% during final 2 weeks, versus Miliband’s minus 20%. In April 2010, Brown’s net likeability rating was minus 7% (https://www.ipsos.com/ipsos-mori/en-uk/would-labour-have-won-2010-if-blair-was-still-leader).
The double digit drop in Labour votes in the former Red Wall constituencies owed in part to toxicity of Corbyn in minds of lifelong Labour voters (https://www.theguardian.com/politics/2019/dec/14/i-saw-just-how-many-voters-were-hostile-to-jeremy-corbyn, https://www.theguardian.com/politics/2019/dec/10/corbyn-criticism-was-banter-says-jonathan-ashworth).
“The two parties advocating a hard Leave position towards Brexit were marginalized. The Brexit Party under Farage gained 2% of the overall UK vote, and UKIP just 0.1% support”
Ever since the 2017 election, UKIP has become electorally irrelevant. None of the TV debates featured UKIP. As the Brexit Party entered candidates in only half of the constituencies, their 2% vote share understates their true level of support nationwide. Perhaps their national vote share would have doubled if they competed in all seats. A hypothetical 4% vote would not imply marginalisation of the hard Leave policy, any more than Green’s 2.7% implies marginalisation of their environmental policy. The Tory party’s Brexit policy is to achieve a smooth exit and trade deal with EU. But for all we know, in a year’s time, the outcome could be a no-deal Brexit. It is hard to know what fraction of Tory voters are willing to countenance this outcome.
“Overall, reflecting the public’s position towards Brexit shown in recent opinion polls, the Leave parties won a combined share of the GB vote of 47%, compared with 53% for the Remain/2nd Referendum camp.”
To the extent recent opinion polls concerning Brexit are reliable (recall that they underestimated the Leave vote right up to the Referendum day), it appears there is a slender majority for Remain. As the authors know, it is very difficult to discern the relative support for Leave-Remain from the general election results, which reflect attitudes to other issues such as leadership, party loyalty, socioeconomic policies. Given everyone knows that a Tory majority guarantees Brexit next month, it would have been a rather mute point for the broadcasters to point out the 47%/53% split.
To those comparing this to football, that is an awful comparison.
Democracy should not be a winner takes it all approach. We may as well just have a presidential system without a legislature in that case.
Vote share should matter to the nation and its main party: a party that refuses to compromise with its minorities, refuses to understand its minorities, and alienates those minorities will polarise a nation, is not a strong government.
What if all who didn’t vote Conservative went on strike? Or took up arms? Or left the country? Minorities have power and rights, and should be respected as such. They should be part of the decision making process, and should be afforded a degree of compromise, in accordance with their vote share.
The shameful shambles of the 2017-2019 parliament has convinced me never to support PR. The winner takes all nature of our system looks to me now to have some important advantages. As for minority rights, sure, but the pendulum swung so far as to try and delegitimise a view purely because it was majoritarian. The 1960s ultra liberal experiment is over and the push back is well and truely in progress.
Maybe I’m wrong but I don’t think you can predict vote shares from exit polls. They don’t account for people who previously voted but who stayed away this time. And (2) voters want to know primarily who will govern them and not, for example, how brilliantly Labour did even though it lost the election! And (3) the programme showed the share when it was available – the complaint in the blog is a bit like complaining that readers of a novel didn’t find out the ending because they only read the first page. And (4) your suggested intro for Huw reads badly and is way too long (the tyranny of the clock is absolute) – don’t give up the day job.
You do realise that this is complete and utter drivel. The exit poll was spot on and framed nothing but the actual results. Elections in the UK are based around winning seats not vote share. The exit poll is an indicator of the possible result which, in this case was accurate to within 1 seat. To claim any other “narrative” defies belief.
Doesn’t change the fact that the labour party Lost dramatically.
That’s not bias to say!
So get over it the outcome is the same.
It’s almost as if elections are determined by the number of constituencies won, and most viewers are more interested in who will be governing the country rather than soiling themselves in indignation that their preferred party got trounced.
Disappointing and a very weak article. I’d expect something much better from two such distinguished academics.
Firstly, it reads awfully like sour grapes.
Secondly, there is a claim that the coverage was a great ‘scandal’ but with no comparisons to back it up. Did the other channels take a similar or different approach? How does the timing and presentation of the vote figures compare with previous elections? Was the BBC’s coverage this year totally different or, in fact, in line with coverage in previous years? Did you also contact John Curtice or anyone involved in the exit poll or BBC coverage to discuss this and find out why it was done in this way?
Poor, under-researched and bitter.
This is similar to a football analysis that although the team lost 10-1, they in fact had 60% of the possession, and the centre back put in an unusual number of tackles. So what, that’s not how the game is won.
An alternative football analogy: the FA decides football matches should be played in 4 quarters and the team that wins the most quarters wins the game. 1-0, 1-0, 0-10, 0-0 and the home team wins, sounds sensible.
‘However, we won the argument’…
Sure, agree, but focusing on the ‘winners of the game’ is only one possibly way to frame the story. It addresses the outcome for power (goals/MPs) but not the meaning of the contest and why the outcome happened. If you want to understand the reasons for party choices, you need to ask the voters. . Like football, you wouldn’t want to just know the result, presumably, without also watching the game,
Guys you lost, get over it.
This seems desperately thin. Of course the BBC (and the other broadcasters, by the way) focused on the exit poll and seat count, because this is how the election was decided. If the aim had been to maximise vote share, the parties would presumably have campaigned differently and the result may well have been different too. But it wasn’t.
Put it this way, do you think football fans are more interested in goals scored, or some combo of possession and shots on target?
Whilst accepting the underlying argument here I would also point that the situation in Wales is capable of a similar analysis.
The conservative / labour situation is a shade closer, 36% vs 41%, yet Plaid with 10% of the vote get 4 MPs.
I am not aware that the significant Conservative minority vote in Wales, which has existed over some time, has been the subject of notable debate over the last decade.
I fully recognise the somewhat perverting consequences of FPTP elections (although perhaps the last parliament did little to advance the case of PR) and that there should be an attempt to inform with the widest possible array of numerical data.
I don’t particularly see a reason to call this a scandal however. Failure to differentiate (pun intended) the electoral percentage and the first order change in that percentage, or to use those figures with loose intent to substantiate a narrative, is part of the normal dialogue we experience in our media culture.
Until there is a desire within society to be numerically informed across a wider range of parameters, to understand state, first and second order change in data, is this not simply an argument that you prefer one metric over another ? Unless the production controllers in whatever media we choose are required to have a numerical qualification of some consequence would you anticipate progress in this area ? Not impossible I agree, but indicative of direction if the answer is no.
I would also add that I accept in your comments on Scotland you do raise issues akin to those in Wales, so I am not suggesting a specious blindness in the article.
As Wales has 40 seats, 4 seats for a 10% vote share seems fine.
Indeed.
So despite FPTP being regularly and appropriately subject to attack for its disproportionate outcome, here you have highlighted that it can produce a numerically proportionate result; I have no problem in taking some pleasure from that unusual situation, where a party has a lower percentage of the vote.
My comment was not about the Welsh result being perverse, but that the authors had selected the late appearance of one set of figures and suggested this was a scandal. I’m suggesting that anyone, at anytime, could pick any figure and claim that the decision not to discuss that metric was a scandal.
That the BBC produced this figure late in the process is very likely true. That in consequence we have a scandal did not seem to be a consequential conclusion.