![]()
![]() Using a random sample survey and self-reported data on infection and symptoms, Patrick Sturgis and Jouni Kuha find a symptomatic infection rate in the general population of Great Britain of approximately 10% by the end of April.
Using a random sample survey and self-reported data on infection and symptoms, Patrick Sturgis and Jouni Kuha find a symptomatic infection rate in the general population of Great Britain of approximately 10% by the end of April.
Any attempt to estimate the population infection rate must deal with two key challenges: how to measure infection and who to make the measurements on. Available methods for estimating the population infection rate have different balances of strengths and weaknesses with regard to these matters of measurement and sampling, respectively.
The most discussed approach to measuring population prevalence are the antigen tests carried out daily by Public Health England. These show that (as of 7/05/20) 1,139,626 people had been tested and 206,715 had tested positive – an infection rate of 18.1%. However, because these tests are targeted at groups likely to have contracted the virus, they will tend to over-estimate the population infection rate.
Antigen tests are also of limited value for estimating the population infection rate because they only identify people who are currently infected and will, therefore, miss the small but growing section of the population who have recovered from an earlier infection. For example, an ONS survey of 10,000 households found an infection rate of 0.27% between 27 April and 10 May, which is likely considerably lower than the proportion of people who have ever been infected.
Here, we assess whether random sample surveys using respondent self-reports of infection and symptoms can help get a better picture of the true rate of symptomatic infection in the population. To do this, we analyse data from the Wellcome Trust UK Monitor survey which was carried out on the NatCen probability-based panel between 30 March and 26 April.
The key advantage of probability surveys for estimating the population infection rate is that, in theory at least, the random selection of sample members from the target population will give approximately accurate estimates of population characteristics.
The corresponding disadvantage of surveys is that measuring the infection status of respondents is challenging. The best way to do this would be to administer both viral and antibody tests and, indeed, this is what the government is proposing to do when an accurate antibody test is available. In the meantime, we must rely on respondents telling us whether they think they have had the coronavirus and its associated symptoms and this kind of subjective data is clearly subject to a range of potential errors.
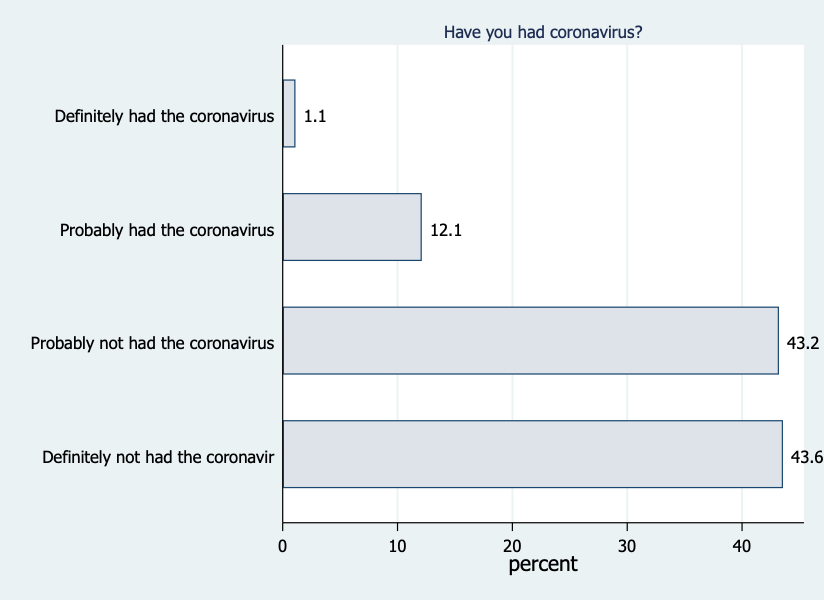
The 2,400 respondents in the Wellcome Trust Monitor sample were asked to give a probabilistic assessment of whether they have had the virus and ten of the most common symptoms of COVID-19. As shown in the Figure below, 0.9% said they had ‘definitely’ had the virus, 12% ‘probably’ had the virus, 43% ‘probably not’ had the virus and 44% had ‘definitely not’ had the virus (0.7% said that they did not know).
Combining those who say they have ‘definitely’ or ‘probably’ had coronavirus, gives a crude estimate of the symptomatic infection rate of 13%. However, some of those who think they have had the virus will not actually have been infected (false positives), while others are likely to have been infected but say they have not (false negatives).
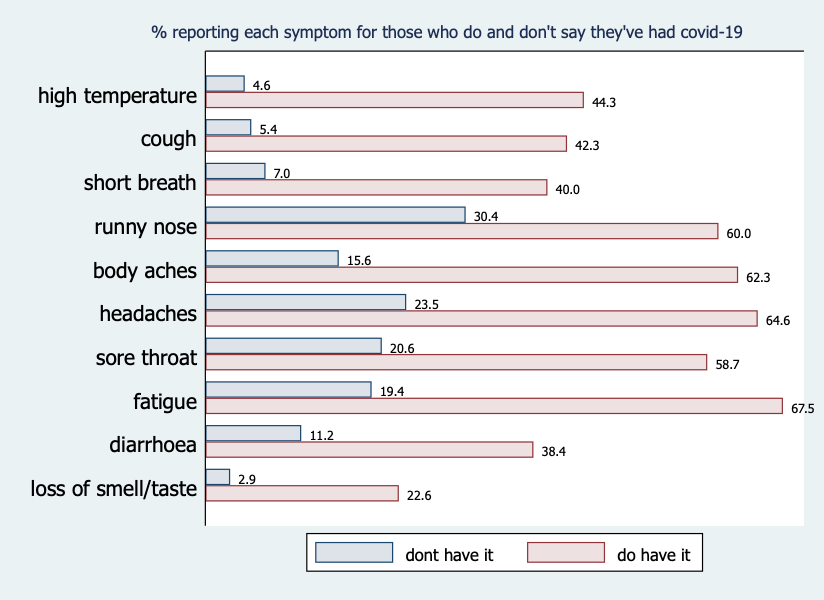
One way of assessing the extent of these reporting errors is to cross-check self-reported infection status with reported symptoms. All respondents were asked whether they had experienced any of ten common COVID-19 symptoms since the start of February.
The figure below compares the reported rate of each symptom between those who say they have had coronavirus and those who say they have not. By taking the ratios of reported symptoms for these two groups, we find that the most distinctive symptoms are high temperature (ratio = 10), new cough (7.2), loss of taste/smell (8.5), and shortness of breath (5.4). This pattern is consistent with the list of typical symptoms reported by the World Health Organisation and the Centers for Disease Control.
Of those who said they have probably/definitely had the virus, 22% reported having had none of the five most distinctive symptoms, so these seem likely to be false positives. The high apparent rate of false-positives should be a concern for policy-makers, as many in this group are likely to (falsely) believe they are immune from infection and so cannot pass the virus on to others.
On the other hand, 3% of those who said they probably/definitely have not had the virus reported three or more of the five most distinctive symptoms. If we remove the false-positives from the group who report having been infected and incorporate the apparent false-negatives, we obtain an overall symptomatic infection rate of 11%.
A different way of estimating the symptomatic infection rate is to use a statistical model called Latent Class Analysis (LCA). This is a method for detecting groups or clusters that underlie distinctive patterns of response. We applied LCA to the symptoms data, focusing on a model which identifies four clusters of symptoms, as shown in the table below.
The numbers in the cells of the table are the probabilities for the people in each class of reporting each symptom and the numbers in bold are the proportion of the sample in each class. So, for example, 20% of people are in Class 3 and people in Class 3 have a probability of 0.34 of reporting a high temperature.
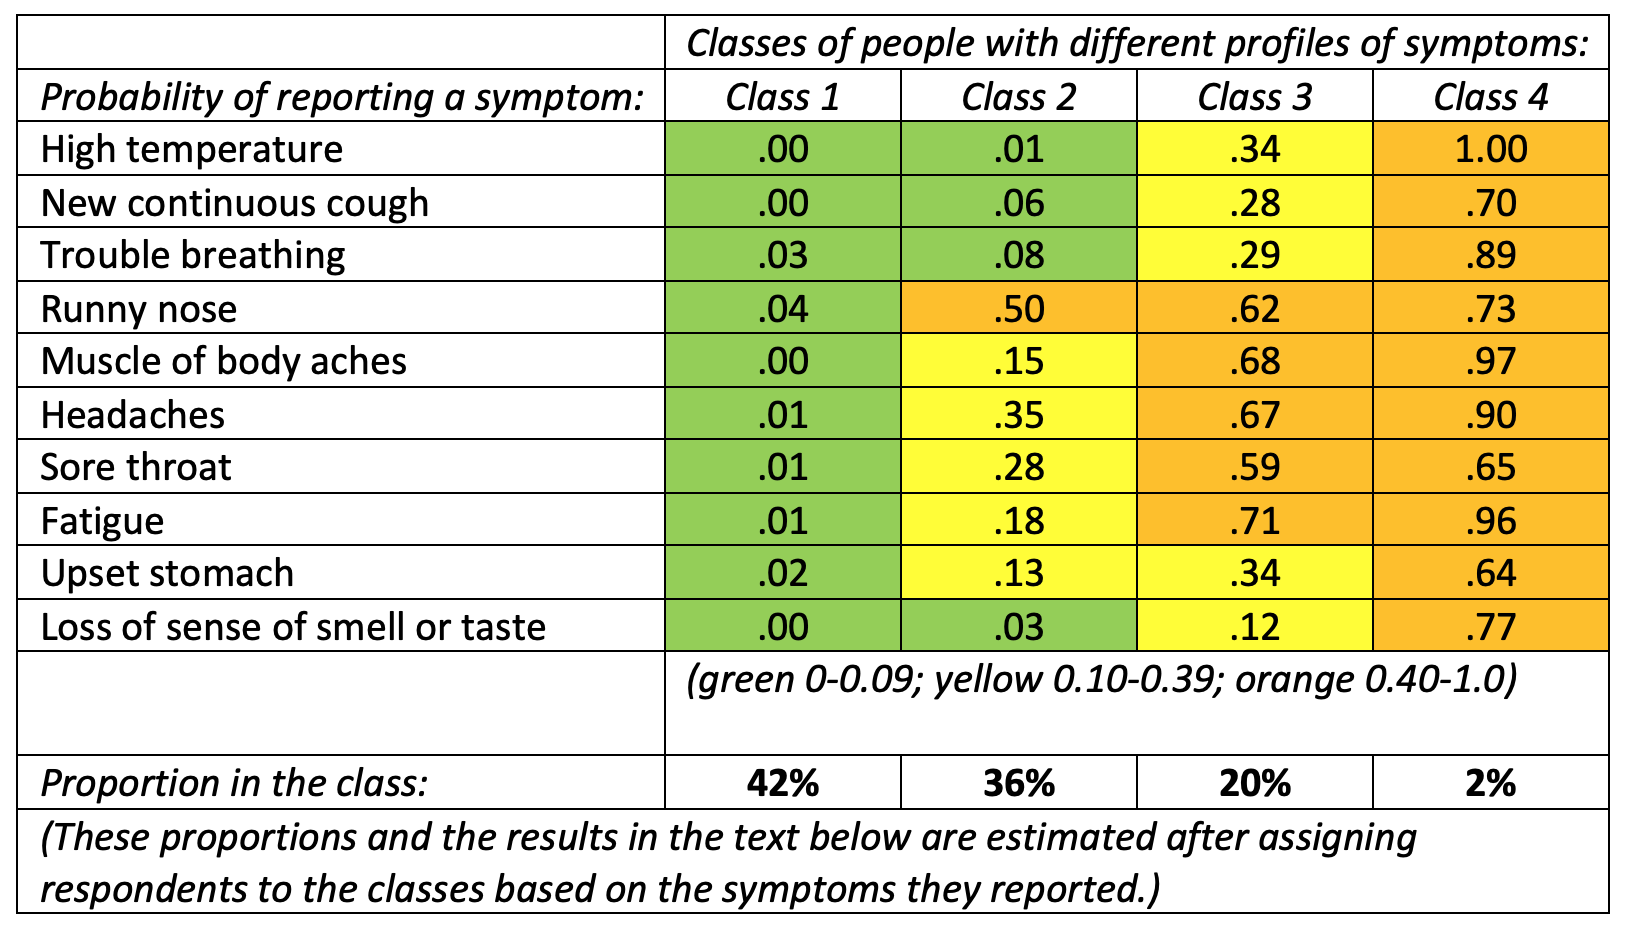
The pattern of probabilities for each class enables us to identify different symptom clusters. We can label Class 1 (42% of the population) as the non-symptomatic group as they have near-zero probabilities for every symptom. Class 2 (36% of the population) display the symptoms of the common cold but not the main symptoms of COVID-19. People in Class 4 (2% of the population) have a high probability of reporting all ten symptoms, so they show strong signs of having been infected.
Class 3 presents a less clear picture. This group has moderate probabilities of the core symptoms and higher probabilities of the others. So, Class 3 seems to contain a mixture of the infected and the non-infected, but we cannot distinguish between them based on these self-reported symptoms alone. The difficulty of identifying a single distinct cluster of COVID-19 symptoms is in line with research that suggests symptom patterns are quite variable across individuals.
One way to separate out the COVID-19 group in Class 3 is to combine class membership with self-reported likelihood of having been infected. Of the people assigned to Class 3, 34% said they have definitely or probably had COVID-19 (compared to 4%, 9% and 72% of those in classes 1, 2, and 4, respectively). If we combine these respondents with everyone in class 4, we get an estimated symptomatic infection rate of around 9% – similar to the 11% we found using a more ad hoc approach.
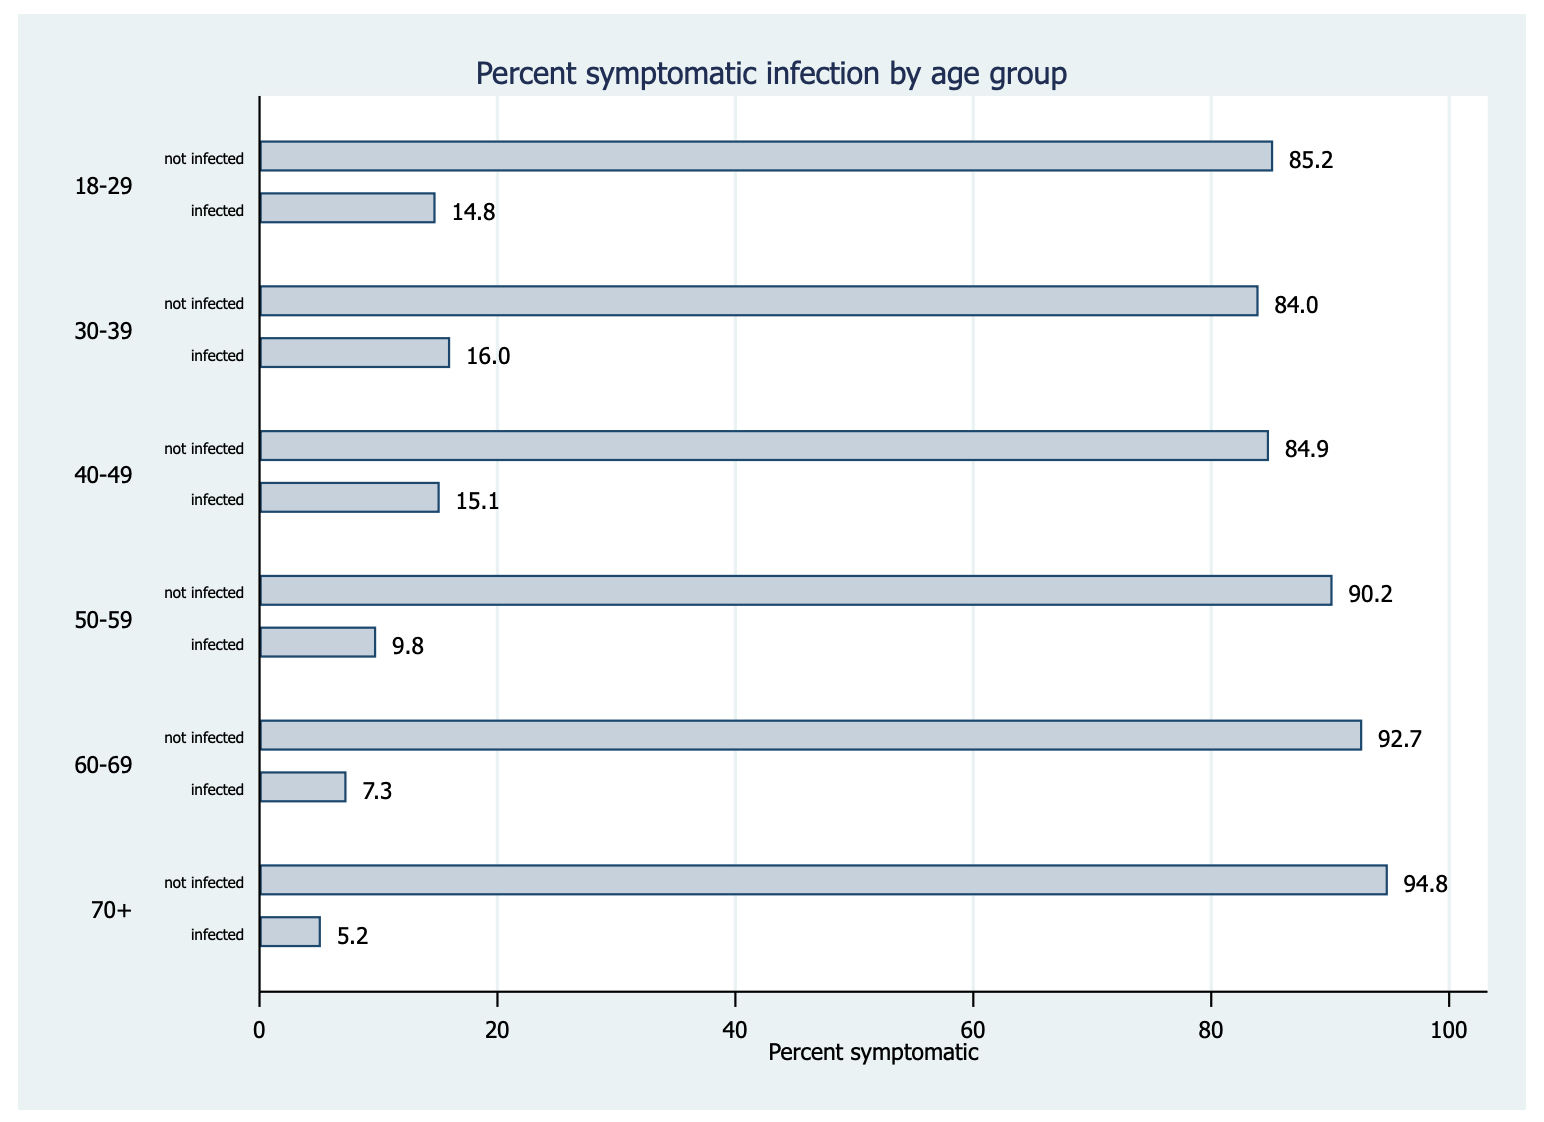
Finally, because the Wellcome Trust Monitor survey contains lots of other information about respondents, we can compare infection rates across demographic groups. Interestingly, we find no statistically significant difference in the symptomatic infection rate between men and women, or between people with different levels of income, even though substantial gradients have been found between these groups in COVID-19 fatalities by the Office for National Statistics. It would seem, then, that susceptibility to infection by coronavirus is more evenly distributed across demographic groups than are fatalities.
One exception to this pattern is age. Here we find that older people are the least likely to report symptomatic infection, with only 5% of the over 70s falling into this group, compared to 15% of those aged 18-29. This suggests that, while older people are most likely to die from a coronavirus infection, they are less likely to become infected in the first place. This seems likely to be a result of older people following government advice to shield themselves from infection by staying at home and avoiding social contact.
The estimates of infection we have presented here should be treated with caution. Their key strength is that they are based on data from a high-quality random sample, their corresponding weakness is that respondent self-reports of infection and symptoms are prone to errors of both omission and commission. And, of course, self-reports can only ever be informative about the symptomatic infection rate, so will miss anyone who has been infected but displayed no symptoms.
We will not know the true rate of COVID-19 infection in the population until the results of the government’s large-scale random testing programme are available. Until then, these kinds of estimates can help to give a sense of the current rate of symptomatic infection in the general population.
___________________
Note: the above was first published on LSE COVID-19 and represents the views of the authors only. Featured image credit: by United Nations COVID-19 Response on Unsplash.
![]() Patrick Sturgis is Professor of Quantitative Social Science at the LSE Department of Methodology.
Patrick Sturgis is Professor of Quantitative Social Science at the LSE Department of Methodology.
![]()
Jouni Kuha is Professor of Social Statistics at the LSE Department of Methodology.


1 Comments