 In European election terms, the Liberal Democrats are now a major party. Heinz Brandenburg looks at what the 2019 election results tell us about the limitations of tactical voting. He analyses the difference Change UK and UKIP withdrawals from the contest would have made and explains why the d’Hondt system punished the Conservatives so badly.
Nigel Farage and his Brexit Party may have been the main story of the European election. His party topped the poll and won the most seats. However, if you are interested in how the electoral system used for European elections performed, the Brexit Party is not the most interesting story – despite it being a telling feature of the electoral system that they managed to translate 30.5% of the UK-wide vote into 40% of seats.
More interesting are the ‘Remain parties’ – the group of parties that went into the election sharing the goal of wanting another EU referendum but not being able to strike any deal or pact, thus leaving Remain voters wondering how to avoid wasting votes. I am going to look at two lessons that can be drawn from their respective performances across electoral regions: one about the role of variation in district magnitude, and the other about the limits of tactical voting.
As such, the ‘Remain parties’ – the Liberal Democrats, the Greens, Change UK, the SNP, Plaid Cymru and the Alliance Party in Northern Ireland – accomplished something astonishing: they nearly translated their vote share 1:1 into seat share, despite a not quite proportional system which seemed heavily stacked against them (see Figure 1). That brought them in total 28 seats, just one behind the Brexit Party.
The regional parties – the SNP, Plaid Cymru, and also the Alliance – as soon as they get over the threshold in three or four-seater constituencies tend to get treated quite well by the electoral system. But the Liberal Democrats also managed to translate votes into seats at a ratio of more than 1:1. The Greens remained the only of these parties to win fewer seats than would have been proportional, while Change UK failed to reach the threshold for a seat in any region. The closest they came was in the South East, where they won over 105,000 votes, but that still left them almost 80,000 short of winning a seat.
Overall then, not only did the various Remain parties gain substantial support over the last three weeks or so of the campaign, they also managed to translate that into seats – which was a major worry for Remain/second referendum campaigners.
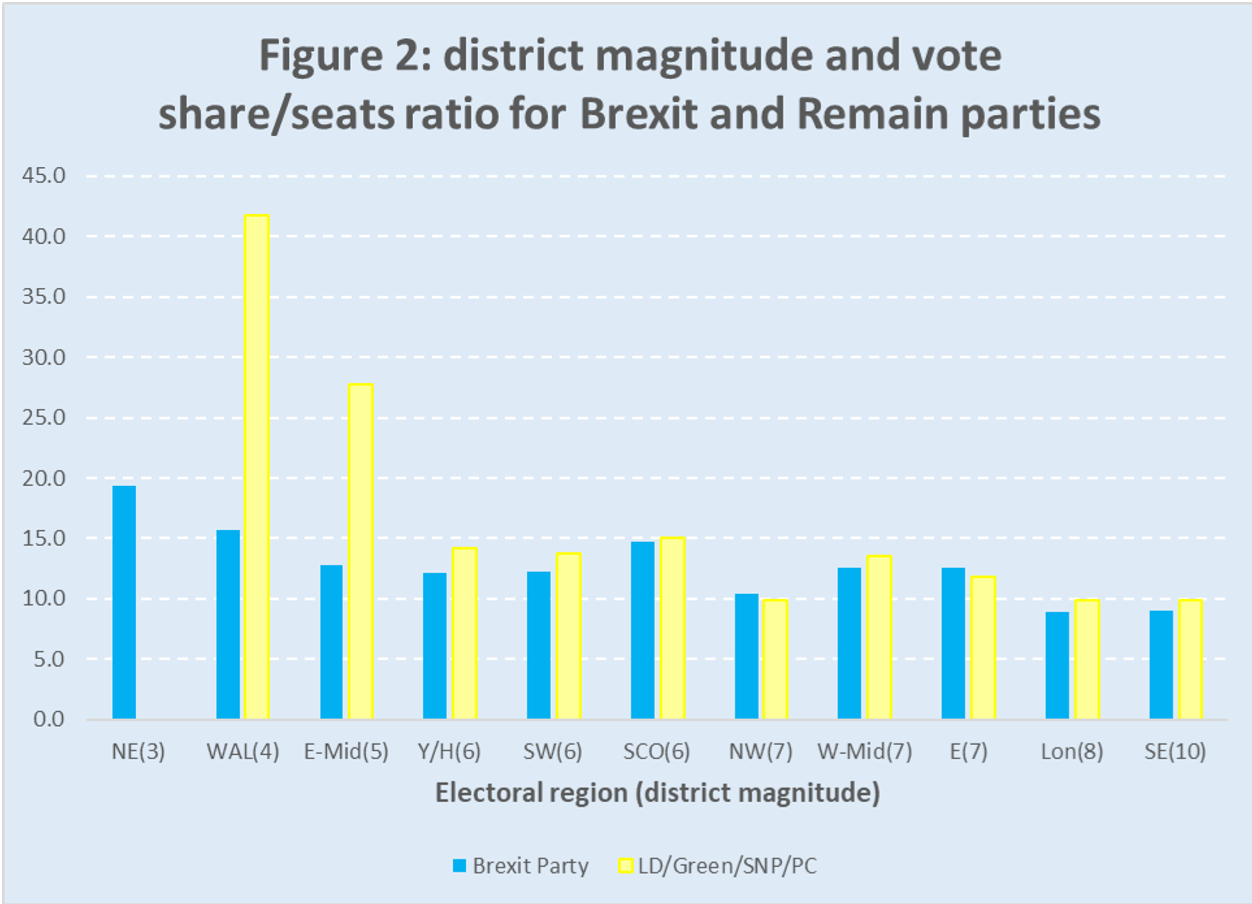
The fact that the Brexit Party outperformed the Remain parties in terms of seat share simply illustrates how much better off a single party is against a fragmented opposition when disproportionality is high. It is all down to district magnitude. Figure 2 shows that in electoral regions with six or more seats, the Remain parties (Lib Dems and Greens, plus the SNP in Scotland) converted vote shares into seats at about the same rate as the Brexit Party. It is only in the three most disproportional races – in the North East, Wales and the East Midlands – that fragmentation hurt: Remain parties only won two seats between them across these three regions, against seven seats for the Brexit Party.
It is difficult to say how much of this relatively effective performance of Remain parties was down to tactical voting – and if so, if it was the tactical desertions of Labour and Conservative supporters that made the difference. Much of it was a late swing towards the Lib Dems in particular rather than any reapportioning of votes from one to another Remain party within regions, as advocated by tactical voting guides. While Change UK lost some ground in the final days of the campaign, Labour and the Conservatives lost a lot more, and most of that seemed to have gone towards LibDems and Greens rather than to the Brexit Party. In the end, the Liberal Democrats performed as you would expect from one of the larger parties. The Greens did not get quite there, but also had not only their second best European election in terms of vote share (after 1989) but by far their most effective campaign in terms of converting votes into seats.
In sharp contrast, the Conservatives had their first experience of how a not particularly proportional electoral system treats a minor party. Figure 3 shows them to be the most ‘wasteful’ party – they required nearly 400,000 votes for every single seat they won. Back in 2014, the Conservatives just as Labour were still where the Liberal Democrats are now – a party that receives over 20% of the vote share and hence gets a seat for every 200,000 votes or so it wins. The Brexit Party only very marginally outperformed 2014 UKIP, both gaining a seat for every 180,000 or so votes. Perhaps surprisingly, Plaid Cymru is the most economical party in this regard: they only ever win one seat, but only require between 110,000 and 160,000 votes to do so.
Finally a hypothetical scenario: in hindsight, the only meaningful and risk-free form of tactical voting could have been instigated by Change UK through what Heidi Allen proposed: withdrawing their candidates in most regions, or indeed taking away their 571,846 voters by abandoning the party and voting tactically for either the LibDems or the Greens. What would have been the impact?
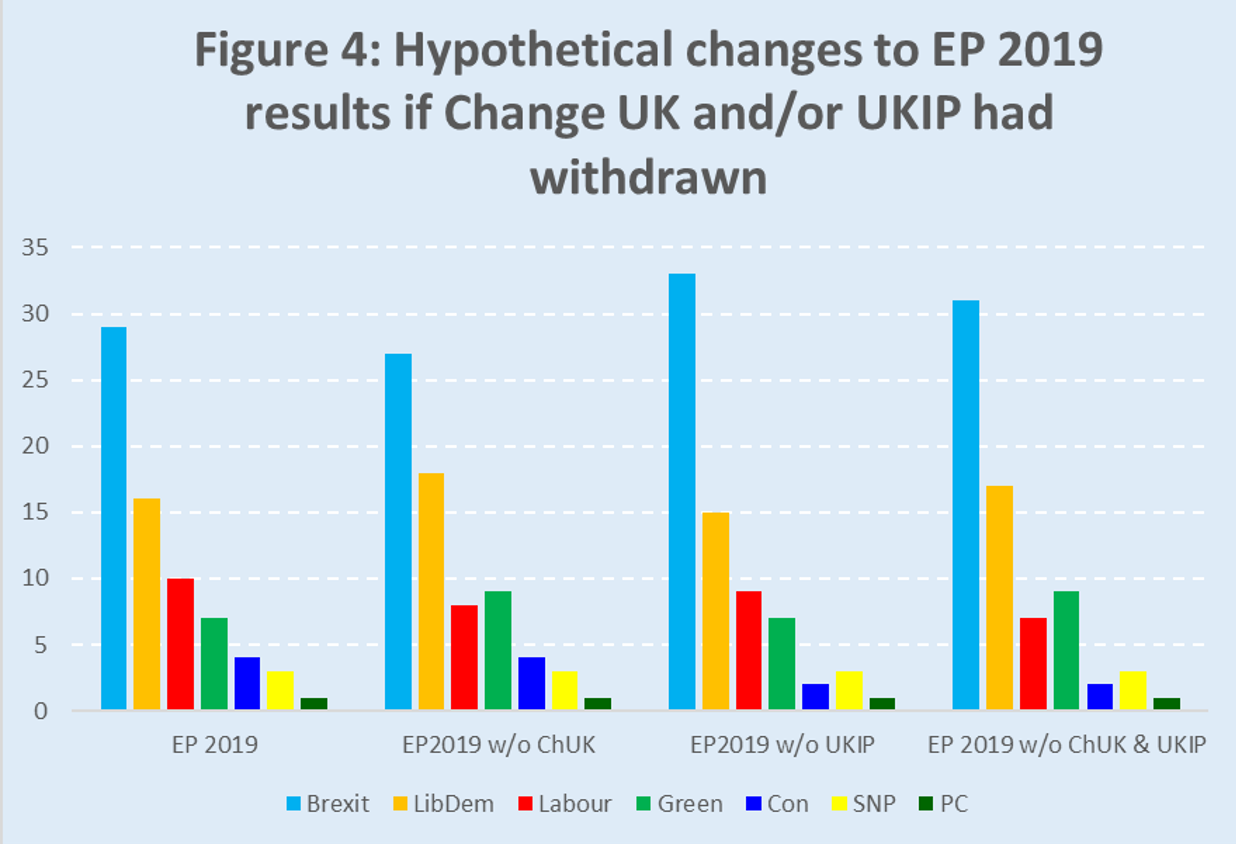
Assuming, optimistically, that they had done so for maximum impact (i.e. collectively voting in each region for the party that most needed their votes), this would have resulted in both LibDems and Greens gaining two seats at the expense of the Brexit Party and Labour (Figure 4). However, to be fair, UKIP ‘wasted’ almost exactly the same number of votes as Change UK. And if their voters had instead gone to the Brexit Party, they could have added four seats too, this time at the expense of the Conservatives, the Liberal Democrats, and Labour.
If both UKIP and Change UK had withdrawn, then we would have seen the Brexit Party gain three seats, the Liberal Democrats and Greens two each, with Labour losing three and the Conservatives two. The polarised No Deal versus No Brexit result would have become even starker. And it would have ended in a tie, at least for the observer who wants to sum up the votes of five parties that differ on many policy positions but agree on their Brexit stance: Brexit Party 31 seats, Remain parties (Lib Dem, Green, SNP, PC, Alliance) also 31.
Interestingly, the presence of UKIP in the race helped the Conservatives – who might otherwise have lost another two of their four seats – while the presence of Change UK helped Labour, who might otherwise have been left with not ten but seven or eight seats.
In conclusion: yes, there certainly was a lot of tactical voting – Labour and Tory supporters abandoned their parties in droves, and if that was a temporary measure rather than a definitive switch of allegiance, we might well call that tactical voting. But that had little to do with what was advocated by tactical voting guides, which would have involved complex coordination of the trading of votes between Remain parties across a diverse set of electoral contexts in order to maximise seat gains.
Ultimately, a considerable swing from Labour and Conservatives towards Remain parties throughout the campaign produced a situation in which fragmentation of the Remain vote had surprisingly little detrimental effect on how their votes translated into seats – mainly because it turned the LibDems into what counts by European election standards as a major party.
__________________
Note: this post was originally published on LSE Brexit. Featured image credit: Pixabay (Public Domain).
 Heinz Brandenburg is Senior Lecturer in Politics at the University of Strathclyde.


Actual UK results would help make more sense of this but I can’t get mine to you efficiently 🙁
After 373 of 373 counts complete Seats % votes/seat
The Brexit Party 29 31.6 180983
Liberal Democrat 16 20.3 210455
Labour 10 14.1 234725
Green 7 12.9 289054
Conservative 4 9.1 378036
Scottish National Party 3 3.6 198184
Plaid Cymru 1 1.0 163928
Sinn Féin 1 126951
Democratic Unionist Party 1 124991
Alliance Party 1 105928