 Jonathan Wadsworth explains why the furlough scheme seems to have done its job in preventing mass layoffs, as well as other reasons why the total entering unemployment is still much lower than in the 2008-2011 downturn.
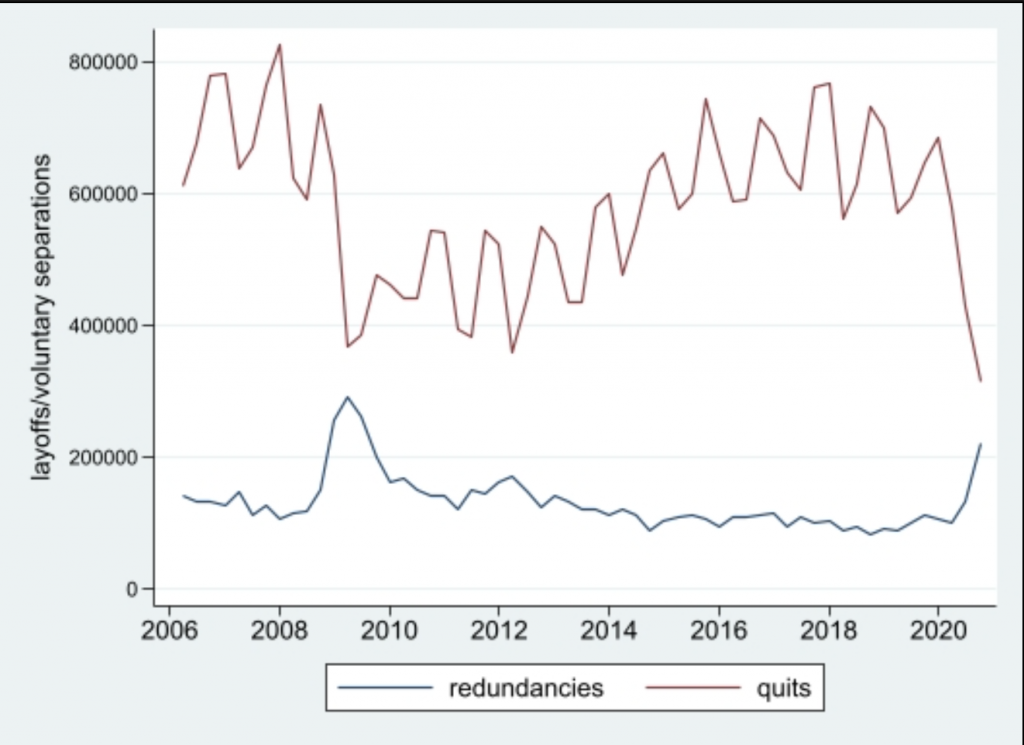
The recent announcement of the prolongation of the government’s furlough scheme under the latest lockdown is almost certainly a good thing for jobs. Despite this, ONS’s review of the recent patterns of redundancies showed that, by the end of August, layoffs were running at their highest level since the previous recession of 2008-2011. The beginning of the end of the (original) furlough scheme certainly coincides with the recent spike in layoffs, as can be seen from the blue line in Figure 1 below, which replicates the ONS redundancy data series. Employers were obliged to pay the national insurance contributions of their furloughed employees from 1 August, with further reductions in support and obligation for employers to top up wages in September. It seems that this then was the trigger for the rise. Before this, during the first few months of COVID, there is little sign of an upturn in layoffs, which suggest that the furlough scheme in its original form did its job.
Figure 1: Quits vs Layoffs, 2006-2020.

Redundancies are often seen as commensurate with unemployment – but not always. UK labour laws require most people to have some notice of an impending layoff. The length of notice rises by one week for every year at the firm, up to a maximum of 12 weeks notice, which does at least allow some time to look for another job while still employed. In normal times, between 40% and 50% of those made redundant are back in work within three months. The trouble with recessions is that not many firms hire, particularly not in the current crisis so it is harder now to find alternative employment for anyone laid off. The Labour Force Survey suggests that currently 30% of those laid off in the last three months were in work by August. This percentage is similar to that seen in the 2008-2011 recession. So bad, but not unprecedented.
An important related feature of the labour market is that, alongside redundancies, lots of people move jobs voluntarily all the time. Typically this is because people have found a better job (better in terms of pay or location or hours or just general stuff), or have quit in the hope of finding something better soon. Firms can often use this ‘normal’ turnover to adjust their workforces without the need for mass layoffs.
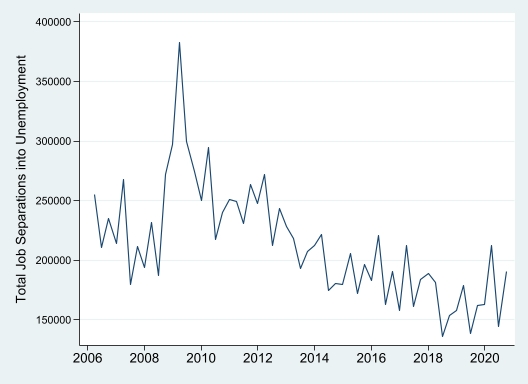
Figure 2: Job quits, 2006-2020
The red line in the left-hand Figure 2 shows the pattern of these job quits over time. Several things stand out. Quits are typically three to four times as large as layoffs. Quits are also quite seasonal. The blips in the red line correspond to the autumn and winter quarters, when quits are at their highest in the year. But the key feature in Figure 2 is that quits have fallen dramatically during the COVID crisis – to their lowest level for 15 years. Job quits always go down in recessions. Fewer firms hire during a crisis, so many fewer people are willing and able to quit their jobs for something different. But this time round, the decline in quits is larger than in the previous crisis.
Why does this matter for unemployment? If we add the numbers who quit into unemployment with the numbers who are laid off and end up in unemployment, then the right-hand panel of the Figure shows that the total entering unemployment is still much, much lower than in the 2008-2011 downturn. This can help explain why unemployment has not risen so sharply (up to the end of August).
___________________
Note: the above was originally published here. Photo by Andrew Leu on Unsplash.
 Jonathan Wadsworth is Professor of economics at Royal Holloway, University of London and a senior research fellow at the LSE’s Centre for Economic Performance.


1 Comments