 On a daily basis we are being presented with new opinion polls on various social and political issues, but do these really represent public attitudes? Using a statistical method called bootstrapping to estimate sampling variance, Patrick Sturgis and Jouni Kuha explain how such an approach can improve the quality of debate about UK public opinion.
The volume and frequency of opinion polls in the UK has increased enormously since the advent of online polling in the early 2000s, bringing with it heightened scrutiny of potential changes in public sentiment on political and social issues. Polls measuring vote intention are now published on an almost weekly basis, even outside election campaigns. And, as the negotiations over the UK’s withdrawal from the European Union edge toward their conclusion, polls on public attitudes toward the rights and wrongs of Brexit and the possibility of a referendum on the government’s negotiated deal feature almost as regularly.
Has public opinion changed?
Whenever a ‘time-series’ poll of this kind is published, commentators are faced with the difficulty of determining whether a change of a few percentage points in a particular direction is due to true change in public opinion, or whether it simply reflects the random variability we should expect to see between any two samples.
For journalists and editors, the incentives are strongly in the direction of interpreting change, no matter how small, as substantively meaningful. ‘No change in party support!’ and ‘Public remain evenly divided on Brexit!’ do not make good headlines. For this reason, the often sensational reporting of political polls in the media has frequently been criticised by academics, politicians, and pollsters alike. Most recently, the report of the 2018 House of Lords Select Committee on Political Polling and Digital Media noted that, “The way in which voting intention polls are represented by the media is often misleading, with a particular tendency to over-emphasise small changes in party fortunes that are indistinguishable from sampling variability.”
The margin of error
To be fair to the pollsters, their published estimates usually come with a health warning about the ‘margin of error’ on their estimates, of plus or minus 3%. This means, for example, that if a poll finds 40% support for the Conservatives, their true level of support in the wider population could be anywhere between 37% and 43%. This serves as a useful, though not fool-proof, bulwark against the tendency of commentators to over-interpret small changes between one poll and the next.
The pollsters’ concept of margin of error, however, is not based on calculations applied to poll data. Rather, it is a heuristic based on an ‘as if’ assumption that the poll was carried out using a simple random sample of 1000 respondents and an estimate of 50%. Were this an accurate description of the poll then the sampling variability would indeed be close to +/- 3% at the standard level of statistical confidence.
But opinion polls in the UK do not use simple random sampling; party shares are rarely 50%; and sample sizes for modern polls are usually different from 1000. What is more, polls use weights to adjust their raw data to be representative of the demographic profile of the general public and this also affects the variability of their estimates. For all these reasons, the margin of error is a quite coarse approximation of the true level of sampling variability for any particular poll estimate.
It is also worth noting that the margin of error heuristic works even less well for estimates of differences than it does for single percentages. Yet, we are often most interested in differences in % support between parties at a particular time, or in changes in support for the same party. It might be assumed naively that the same +/- 3% margin of error could be applied to differences but this is not the case. For example, under the same assumptions of a simple random sample of 1000, the 95% confidence interval for a difference between independent samples for estimates of 50% would actually be +/-4.4%.
It was these inadequacies of the margin of error that led the British Polling Council/Market Research Society Inquiry into the 2015 General Election polls to recommend that polls should “provide confidence (or credible) intervals for each separately listed party in their headline share of the vote” and that they should also “provide statistical significance tests for changes in vote shares for all listed parties compared to their last published poll.”
To date, neither recommendation has been taken up by the UK polling industry. A likely reason for this is that it is widely assumed that sampling variance cannot be calculated for non-probability samples, as standard approaches to estimating sampling variance require the sample to have been drawn using random probability methods. While this is indeed true of standard approaches to estimating sampling variance, alternative methods are available that do not require random sampling.
A new method
In our 2017 Journal of the Royal Statistical Society article, we described such an approach based on a statistical method called ‘bootstrapping’. We can illustrate how this method works using two recent YouGov polls* which included questions on vote intention and whether, in hindsight, the vote to leave the European Union was right or wrong. The first poll was conducted between 28 and 29 May and the second between 4 and 5 June 2017.
Table 1 shows the point estimates and 95% confidence intervals for the ‘was the UK right or wrong to vote to leave the EU’ question. In May the difference between ‘wrong’ and ‘right’ showed an 8-point lead for ‘wrong’. This was the largest recorded lead for ‘wrong’ up to that point and led to widespread speculation that public opinion was starting to turn decisively against Brexit. Barely a fortnight later, however, the ‘right-wrong’ margin was down to one tenth of one percent. Was this change just sampling variability, or did it reflect real underlying change in public opinion?
 The bootstrapped estimates enable us to conclude that the change was unlikely to have been due to sampling variability, with the 95% confidence interval ranging from a low of 3.8% to a high of 12.6%. The margin of error heuristic would not have been applicable here because, as we noted above, it is meant for single percentages and not differences.
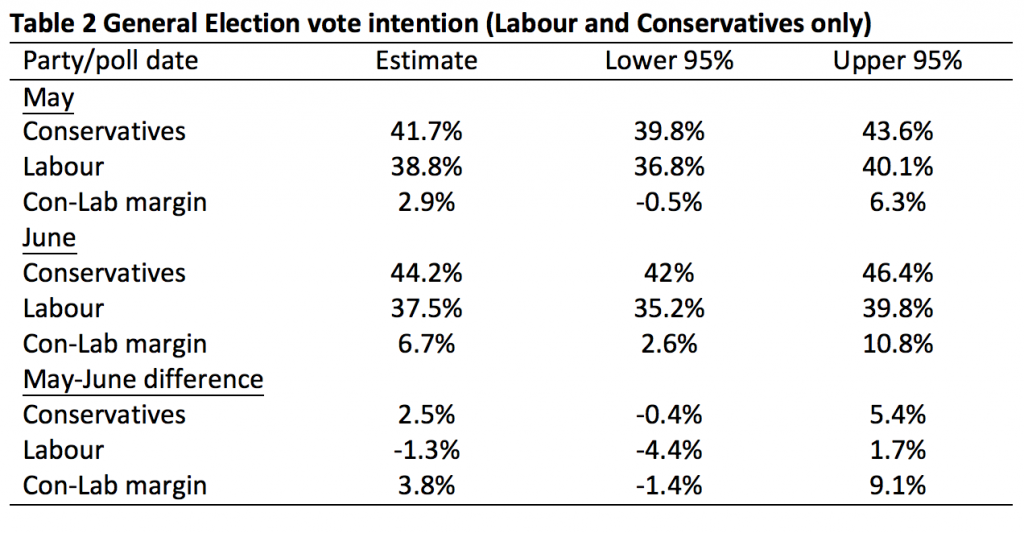
Turning to the vote intention question, we find that the Conservatives held a 2.9% lead over Labour in May, which increased to 6.7% in June. Was this 3.8% increase in the Conservative lead real? Naïve application of the margin of error would lead us to conclude that it was, as it is greater than 3%. However, the bootstrapped 95% confidence interval ranges from -1.4% to 9.1% so we cannot be confident that the change was not due to sampling variability alone.
The way forward
The British Polling Council recently updated its reporting requirements for members to include the following caveat:
All polls are subject to a wide range of potential sources of error. On the basis of the historical record of the polls at recent general elections, there is a 9 in 10 chance that the true value of a party’s support lies within 4 points of the estimates provided by this poll, and a 2 in 3 chance that they lie within 2 points.
While this additional cautionary note is welcome, it does not aid in assessing whether differences in, and changes between, poll estimates can be attributed to sampling variability. Rather, it is an estimate of historical poll error from all sources, for polls undertaken shortly before general elections. As with the margin of error, it too is relevant only for single percentages rather than differences between percentages which are, we contend, of greater utility in assessing the likely outcome of an election. For that, what is needed is a method of calculating sampling variance in a way that reflects the way the poll has been designed and implemented. For a long time, this has not been available for the sorts of non-probability samples that are used by pollsters in the UK. As we have shown here, that is no longer the case and we hope that pollsters will begin to use this or similar approaches in the future in order to improve the quality of debate about the changing contours of public opinion.
____________
Note: the authors are grateful to YouGov for providing access to the micro-data for these polls.
 Patrick Sturgis is Professor of Research Methodology in the Department of Social Statistics & Demography at the University of Southampton and Director of the ESRC National Centre for Research Methods.
 Jouni Kuha is Associate Professor of Statistics and Research Methodology at the London School of Economics and Political Science.
All articles posted on this blog give the views of the author(s), and not the position of LSE British Politics and Policy, nor of the London School of Economics and Political Science. Featured image credit: Pixabay (Public Domain).


Thanks for this, I covered much the same ground on Democratic Audit in ‘The limitations of opinion polls – and why this matters for political decision making’, but shied away from delving into the 95% probability at 50% aspect – and the whole question of weighting. I was afraid it would make the case too technical for the lay reader, but you have done an admirable job of explaining it.
http://www.democraticaudit.com/2018/05/16/the-limitations-of-opinion-polls-and-why-this-matters-for-political-decision-making/