 Updating previous research comparing MPs’ constituencies with their place of birth, Rob Gandy analyses the composition of Parliament as it emerged in the 2017 general election. The new analysis continues to support the argument that localism is on the rise.
I previously discussed on this blog the degree to which UK politicians were ‘local’, using a high-level proxy of the relationship between elected politicians’ birthplace and their constituency. From the results for the 2010 and 2015 general elections I suggested that ‘localism’ in the form of regionalism was in the ascendancy. My parting comment was that there were 105 new MPs elected in the 2017 general election, so what would be their impact? I have now done the analyses, and set out the key points below.
In 2015 the number of MPs born in each UK region per million population ranged from 5.0 for the East of England to 15.1 for Scotland, with a mean of 9.6 (excluding 33 Non-UK MPs). In 2017 the range stretched slightly from 4.7 to 15.3 (for the same two regions), with 32 Non-UK MPs. The regions with the highest rates in 2017 were Scotland, Northern Ireland, London and North West, with the latter showing an increase of six MPs. Interestingly, despite seven more native South West MPs in 2017 the region was still 25% below the national rate.
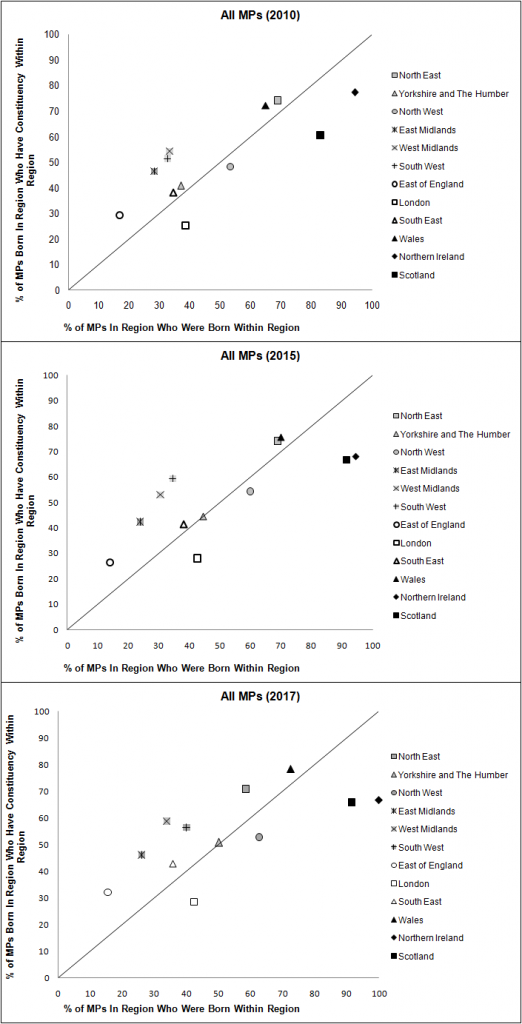
Figure 1 shows the mobility of MPs for 2010, 2015 and 2107, with the bottom-left regions having most mobility and the top-right regions the least. Regions below the diagonal had more MPs who were natives of the region than there were constituencies in the region, and regions above the diagonal had less. There appear to increasingly be a number of groupings: Northern Ireland, Scotland and Wales clearly have the least mobility, and London and the East of England have the highest; the three northern English regions have strong and increasing local representation; whilst the Midlands and the South (outside London) are clustered above the diagonal.
Figure 1: Comparing mobility for MPs at successive general elections 2010 – 2017
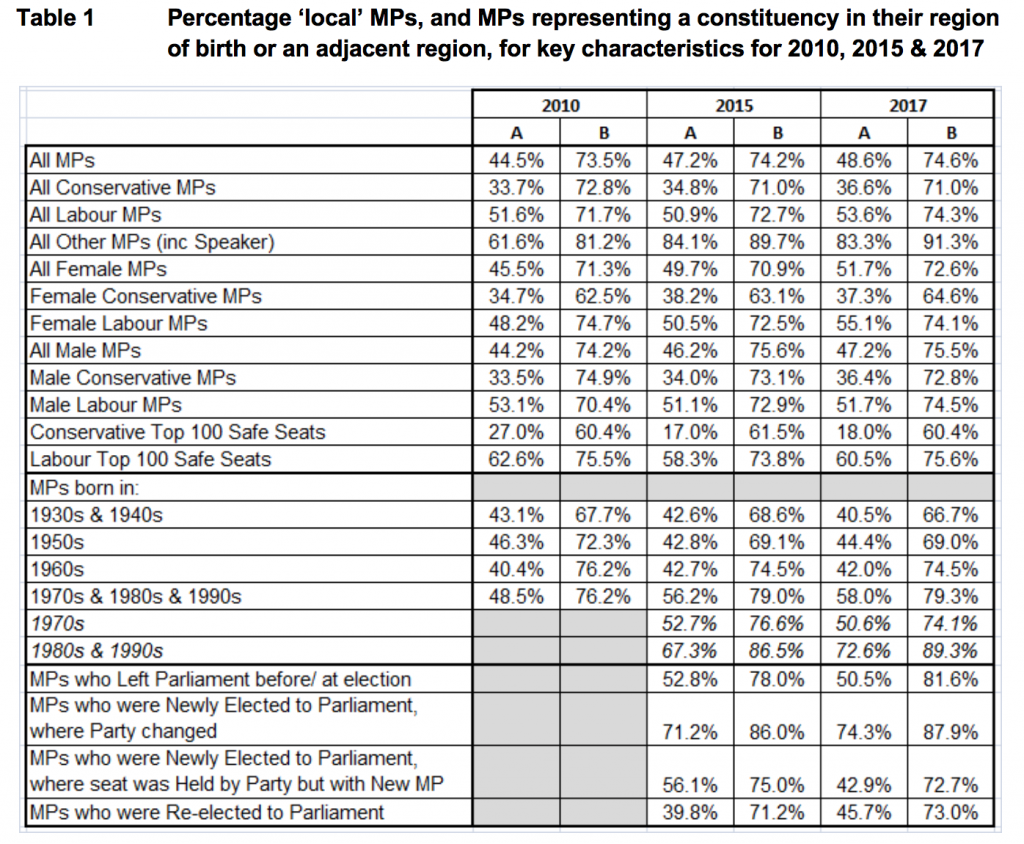
The number of ‘local’ MPs increased from 289 (44%) in 2010, to 307 (47%) in 2015 and 316 (49%) in 2017, i.e. over 9%, with increases in 9 of the 12 regions; most notably the North West and Yorkshire, followed by Scotland, Wales and the South West. Yet the percentage of MPs serving a constituency in their region of birth or an adjacent region increased by only 0.4% to 75%, with those crossing more than one boundary reducing by a corresponding percentage to 25%. Table 1 compares the percentages for ‘local’ MPs, and for MPs representing a constituency in their region of birth or an adjacent region.
 A = Percentage of MPs representing constituency in region of their birth; B = Percentage of MPs representing constituency in own or adjacent region to that of their birth (exc Non-UK MPs).
‘Local’ politicians accounted for 46% of re-elected MPs in 2017 compared to 40% in 2015. Of the 105 new MPs in 2017, 67 (64%) were ‘local’, with 82 (83%) representing a constituency in their region of birth, or one adjacent. New MPs where the party changed had 74% ‘local’ politicians compared to 71% in 2015; but for new MPs replacing the incumbent and the party retaining the seat the figures were 43% and 56% respectively. Of those MPs who left parliament in 2017 50% were ‘local’. Most noticeable were the Conservative MPs who were newly elected to Parliament in 2017: where the party won a constituency from another party, 90% of them were ‘local’; but where they replaced the incumbent MP and the party retained the seat, only 7% of them were ‘local’.
‘Local’ Labour MPs increased from 118 to 140 (up 19%), helping its percentage of ‘local’ MPs to increase from 51% to 54%. This was despite the party not recovering the pre-eminence that it once enjoyed in Scotland; the number of Labour MPs born in Scotland was 47 in 2010, but this reduced to 13 in 2015 (after the Scottish Independence Referendum), before increasing to 19 in 2017. The number of ‘local’ Conservative MPs increased by one; the percentage of ‘local’ MPs increasing from 35% to 37%.
Looking at those seats considered most safe at the 2010 general election, the Top 100 Safe Seats for both parties showed significant differences: whilst Labour’s figures remained consistently high (i.e. 60% ‘local’ MPs and 76% MPs representing constituencies in their own or adjacent region to that of their birth), the figures for the Conservatives were only 18% and 60% respectively.
‘Local’ female MPs increased by 13%, meaning they accounted for 52% of all females. As in previous general elections the Labour Party had greater female representation than the Conservatives, with 118 female MPs compared to 67.
Possibly the most interesting analysis related to age. As noted previously, the older MPs were more ‘mobile’ and the younger ones were more ‘local’. It can be seen from Table 1 that the percentage of MPs born before 1970 that were ‘local’ was broadly similar for each age group, ranging between 40% and 46% at each of the three elections. However, MPs born later were increasingly more ‘local’. But whereas it was found that 51% of MPs born in the 1970s and elected in 2017 were ‘local’, the figure for those born from 1980 onwards was 73%. If adjacent regions are included then these figures rise to 74% and 89% respectively.
The results reinforce the trend towards greater English regionalism, particularly in the North; possibly reflecting dissatisfaction with London-centric politics and mirroring Brexit results and concerns about left-behind communities. Perhaps another factor is that (poorer) young people are living at home and studying at local universities because of the financial pressures. Those who then join a political party would join a branch not too far from where they were brought up; so in future candidates could be increasingly ‘local’ as defined by this research. This is a trend that is likely to continue and so the potential implications need to be carefully considered; might devolution to English regional assemblies be desirable and/or inevitable? What then would be the implications for Parliament itself?
____________
 Rob Gandy is a Visiting Professor at Liverpool Business School, Liverpool John Moores University.
All articles posted on this blog give the views of the author(s), and not the position of LSE British Politics and Policy, nor of the London School of Economics and Political Science. Featured image credit: Pixabay (Public Domain).


This chimes with our own research into a different dimension of localness, i.e. physical distance between voters’ and candidates’ residential addresses. See e.g. here https://www.kai-arzheimer.com/paper/geolocation-voting-candidate-voter-distance-effects-party-choice-2010-general-election-england/ and here https://journals.sagepub.com/doi/full/10.1177/2053168014538769