 Donald Houston illustrates how places with the weakest economies prior to the lockdown have been hardest hit during the pandemic, with seaside towns, rural coastal areas, and the north and southwest of England being particularly affected. Affluent and high-tech or high-productivity areas, and to some extent industrial areas, are least affected.
The UK economy was regionally imbalanced prior to the coronavirus pandemic, which left weaker local economies less able to withstand its economic impacts. Places already with the highest unemployment before COVID-19 suffered the greatest rises. Heavy dependence on the most ‘locked down’ sectors such as tourism and hospitality was damaging for some places, particularly remoter areas on Britain’s west coast.
The full ‘lockdown’ across the UK to control the pandemic in spring 2020 led immediately to an unprecedented rise in unemployment. More than three out of every hundred people of working age moved onto state unemployment benefits in a two-month period (April and May). By October 2020, UK claimant unemployment stood at 2.6 million or 6.3% of the working-age population, ranging from 2.8% in the Orkney Islands to 11.3% in Blackpool. London alone has some 480,000 people on unemployment-related Universal Credit, while Birmingham has more than 80,000.
The scale of the impact nationally and its geographical unevenness both point to structural weaknesses in the economy that leave it vulnerable to economic shocks. The UK’s large service sector, although contributing to employment growth, comprises many sectors characterised by low productivity and businesses with few financial reserves with which to weather a storm.
The national impact on claimant and official unemployment
Claimant unemployment rose from 3% of the working age population in March to 6.4% in May, more than doubling from 1.2 million to 2.7 million. Since April, claimant unemployment has remained at over 2.5 million. This huge and rapid rise occurred despite the government’s Job Retention Scheme.
During the pandemic, claimant unemployment appears to more accurately capture the ‘real’ level of unemployment than the official survey-based measure. Official survey-based ‘headline’ unemployment rose much more modestly from 1.3 million in the first quarter of 2020 to 1.6 million in the three months to September. This is likely to be because many of those out of work are not currently searching for work (job search is a key part of the definition of the official measure of unemployment) since so few employers are hiring. In addition, the gradual replacement of Job Seekers’ Allowance (and other benefits) with Universal Credit has extended the range of benefit claimants who are required to search for work and thus be recorded as ‘claimant’ unemployed (e.g. rather than as sick or disabled). As such, even before the pandemic, the gap between claimant unemployment and official surveyed unemployment had markedly narrowed.
The local impact
The impact of COVID-19 on claimant unemployment rates between March and April (Figure 1) ranges from +0.9% points in Cambridge and South Cambridgeshire, to +3.9% in Blackpool. Analysis of the local increase in unemployment is undertaken to assess the impact of two key vulnerabilities. First, the strength of the local economy pre-COVID. Second, the share of employment in sectors most affected by the lockdown. A fuller published version of the analysis and results, including controls and other effects, is available here.
Figure 1: Change in claimant unemployment rate, March-April 2020 (% of population aged 16-64)
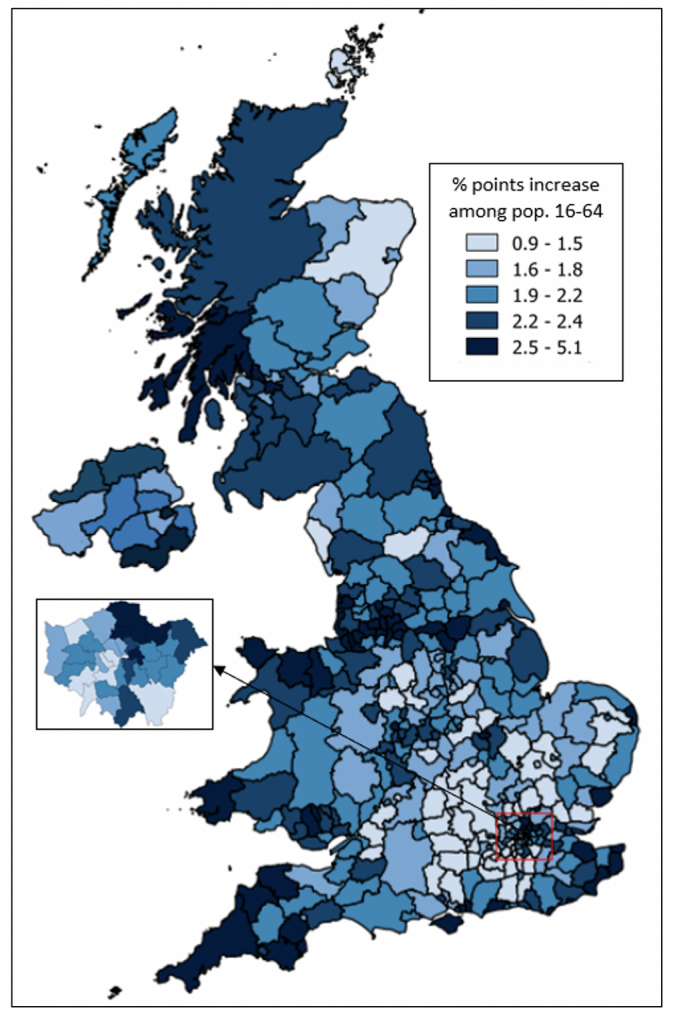 Source: Office for National Statistics Claimant Count (own analysis), Ordnance Survey Boundary Line and Ordnance Survey Northern Ireland Largescale Boundaries, © Crown Copyright and Database Rights 2020 Ordnance Survey & Ordnance Survey Northern Ireland under University of Portsmouth Education Service Provider License. Shetland Islands (cropped from map) fall in the lowest-increase category.

Vulnerability 1: Strength of the local economy pre-COVID
There is a relatively strong relationship between pre-COVID unemployment and the scale of the increase following the lockdown (Figure 2). Overall, pre-COVID unemployment predicts 35.5% of the variation between areas in the scale of the increase. This suggests that the general strength of the local economy prior to COVID-19 is an important factor in explaining the scale of the impact.
Figure 2: Local increase in unemployment according to level of pre-existing unemployment, Local Authority Districts & Unitary Authorities, March-April 2020 Source: Office for National Statistics Claimant Count (own analysis).
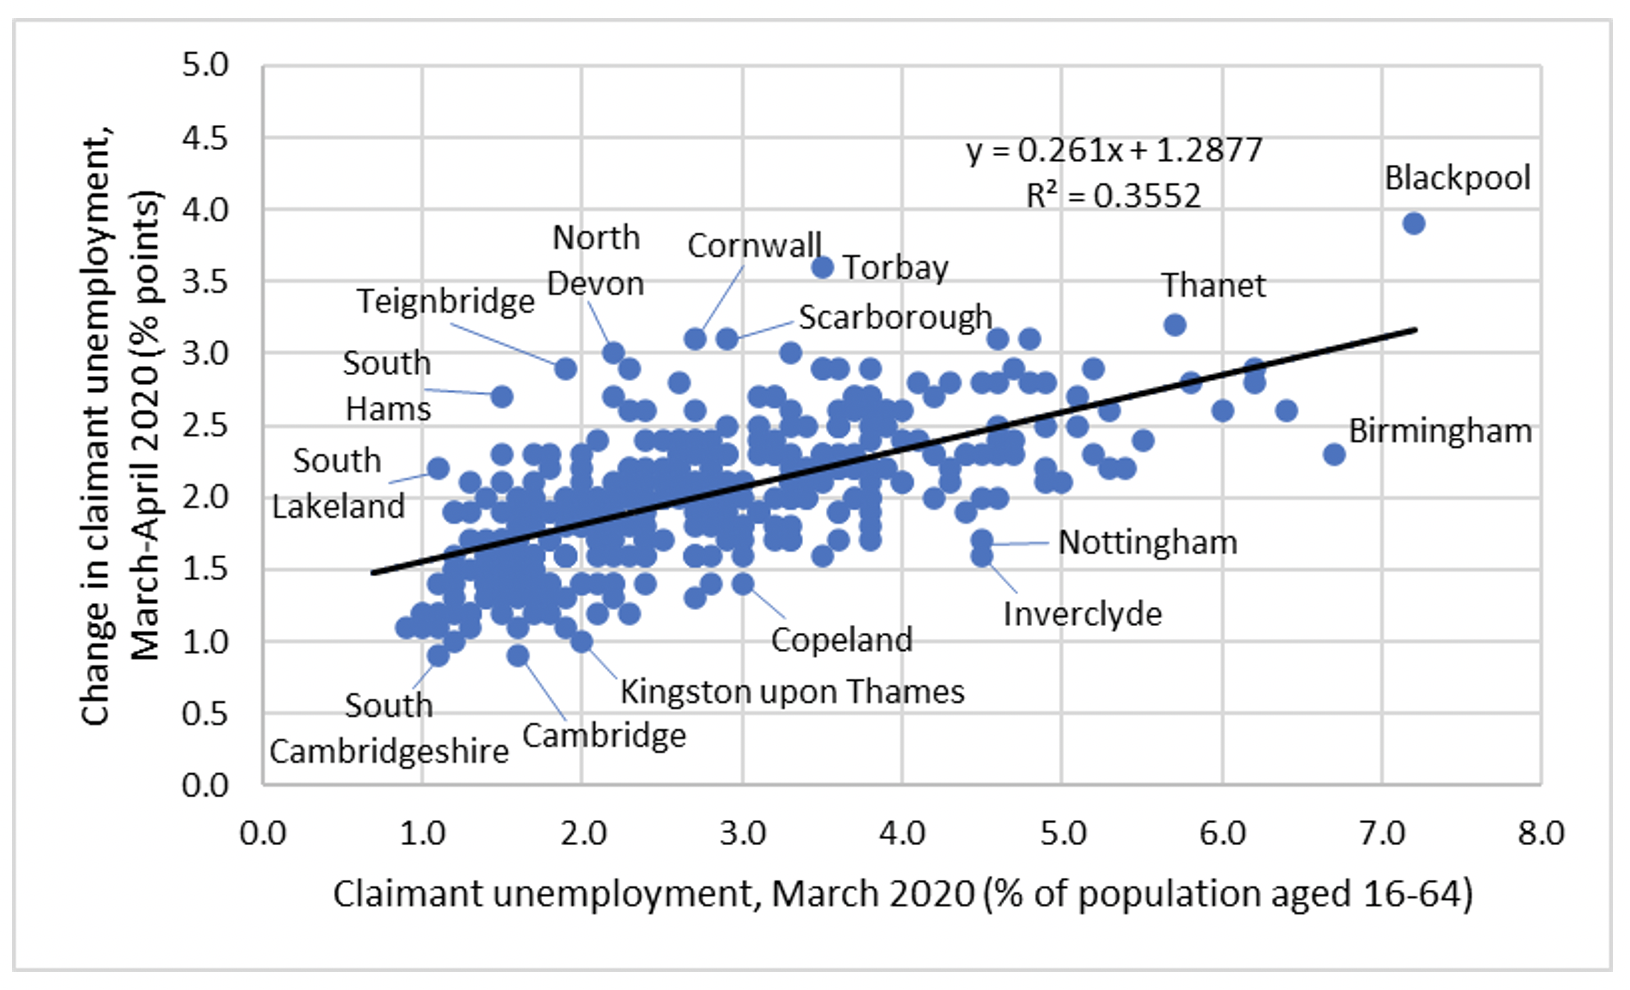
The areas above the line in Figure 2 (indicating a greater COVID impact than predicted based on pre-COVID unemployment) are overwhelmingly coastal. Those towards the top right (high unemployment, large increase) are seaside towns with big tourism sectors. Those in the top left (low unemployment, large increase) tend to be affluent rural areas on the coast, but again with substantial employment in tourism and mainly in the South West.
Vulnerability 2: Share of employment in sectors most affected by the lockdown
The share of employment in sectors most affected by the lockdown is based on the sectors identified as such by the Institute for Fiscal Studies. There is a surprisingly weak relationship between employment in sectors most affected by the lockdown and the scale of the increase in unemployment (Figure 3). Areas with high exposure to locked-down sectors but recording lower-than-predicted impacts tend to be affluent rural areas, affluent London boroughs, and high-tech and high-productivity areas.
Employment in locked-down sectors predicts only 5.7% of the variation between areas in the scale of the increase (Figure 3), substantially lower than the 35.5% explained by the underlying strength of the local economy (Figure 2).
Figure 3: Local increase in unemployment according to prevalence of locked-down sectors, Local Authority Districts & Unitary Authorities, March-April 2020
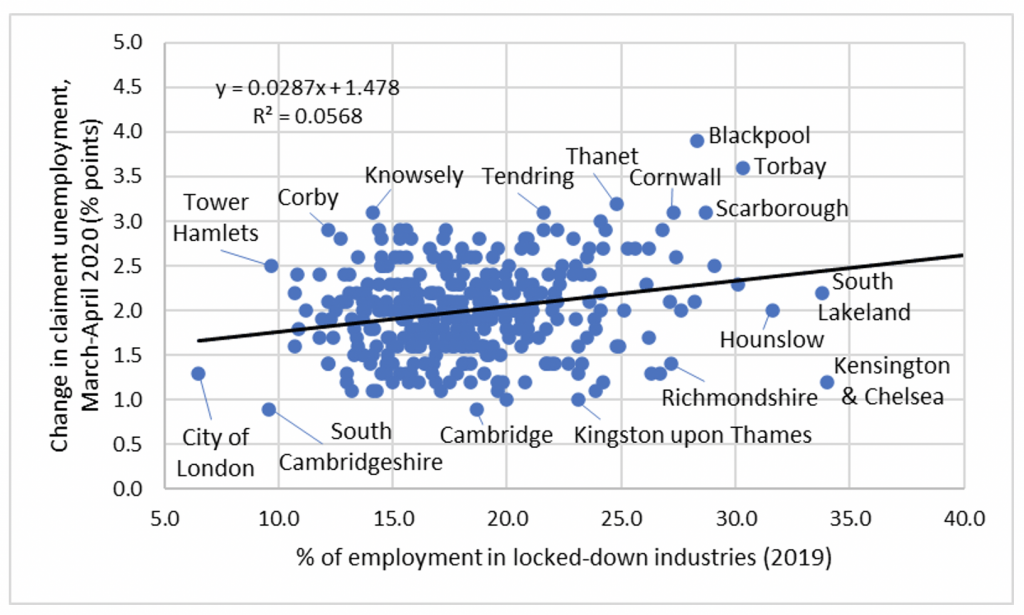 Source: Office for National Statistics Claimant Count and Business Register & Employment Survey (own calculations and analysis).

Conclusions
The impact of the lockdown on unemployment is locally and regionally imbalanced, although everywhere is badly affected. The government has stated its commitment to rebalance the economy across all regions in the UK Industrial Strategy 2017 and the Northern Powerhouse initiative. This challenge for regional policy is amplified by the UK losing access to the EU Regional Development Fund before its replacement, the Shared Prosperity Fund, appears to be fully in place. The double whammy of COVID and Brexit represents a serious threat to the UK economy, particularly its weaker local and regional economies.
The economic impact of COVID-19 will place a huge pressure on public finances. However, the geographical imbalance in its impact requires spending on local and regional economic and infrastructure development to increase, not decrease. Specific policy recommendations include taking local concentrations of unemployment seriously, and reducing region-wide dependence on the visitor economy will reduce vulnerability to future shocks that severely restrict travel.
_____________________
Note: the above draws on the author’s published work in Regional Science Policy & Practice.
Donald Houston is Professor of Economic Geography at the University of Portsmouth.