 In this post, Ruth Dixon argues that, in future elections, measures of party leader satisfaction are worth looking at in more detail, as standard voting intention polls led many forecasters astray in 2015.
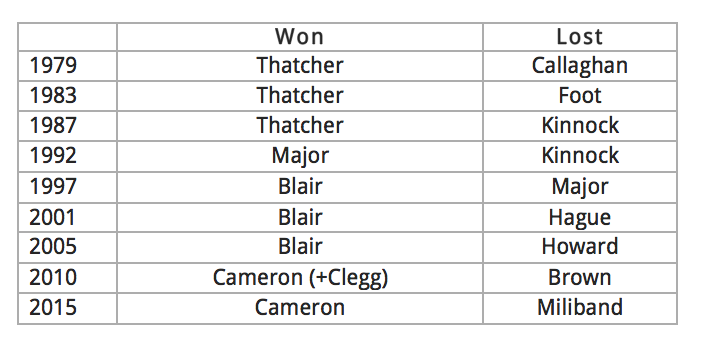
As the plot below makes clear, satisfaction with party leaders of the two main parties would have predicted the outcome of the last nine UK general elections, including the most recent:

Lord Ashcroft’s post-election poll (pdf here) showed the ‘three main reasons for voting’ for each political party in the 2015 UK general election. The biggest difference between parties was the number of people who voted on the basis that ‘the Party Leader would make the best Prime Minister.’ David Cameron, at 71% far outstripped all his opponents, with Ed Miliband (the next most popular) coming in at 39%. On no other question did the Conservatives have such a large lead.

The Ipsos MORI monthly polls go back to 1977 and cover the last 9 UK general elections, which were fought between the following party leaders. In every case, satisfaction with the eventual winner was higher than that with the loser at the last poll before each election. This applied even to elections (such as 1992) called wrongly by the forecasters.
Was satisfaction with the party leader stable?
At least in the short term, there were no sudden changes in party leader satisfaction. Satisfaction with the eventual winner was higher than that with the eventual loser for four months before every election.
What about other parties?
This analysis is most clear-cut when there are only two main parties – as has been the case for most of the last 9 elections. Smaller parties complicate the picture. The Liberals or Lib Dems have had higher party leader ratings than the main parties before some of the last 9 elections. But in almost every case, that popularity did not translate into votes or seats. This may be because many people found Lib/ Lib Dem Policies unobjectionable and were willing to express positive opinions about the leader of a party for which they had no intention of voting. Only in 2010, when Nick Clegg had an unprecedentedly high rating of 68% satisfaction did the Lib Dems win enough seats to gain a place in the Coalition government with the Conservatives. So one needs some knowledge of the overall number of potential voters to interpret party leader ratings correctly.

What about other measures of party leader popularity?
Studies of party leader effects on voting often report the satisfaction index (that is, % satisfied minus % dissatisfied) or changes in satisfaction (or the index) over time. For an overview, see this LSE blog post by Jack Blumenau, which concludes that party leader effects are weak. I think that is because those metrics are too complex.
To explain what I mean, we need to consider that the responses ‘satisfied’ and ‘dissatisfied’ are asymmetric. Party leader ratings reflect two categories of respondents – supporters of the party in question and those who have no allegiance to that party. Supporters are answering the question ‘how well is my party leader delivering policies with which I agree?’, while non-supporters are judging both the policies and the leader. I suspect that people who loathe a party’s policies are far less likely to say objectively that the leader is ‘doing a good job.’ So ‘dissatisfied’ respondents include a high proportion of people who do not support that party, while the ‘satisfied’ category is likely to contain a much higher proportion of party supporters. (Since 1994, Ipsos MORI have reported party leader perceptions among party supporters, which I plan to analyse in a later post).
I therefore don’t find the index, calculated by subtracting ‘dissatisfied’ from ‘satisfied,’ a very convincing metric, as it compares two quite different groups of people.
The index also takes no account of uncertainty; thus a ’10 percentage point’ satisfaction index could represent 55% satisfied minus 45% unsatisfied respondents, or, say, 20% satisfied minus 10% unsatisfied (with a majority of ‘don’t knows’) which represent very different situations. The 2005 election was wrongly predicted by the index as Michael Howard had a relatively low dissatisfaction score, combined with the highest ‘don’t know’ score across the whole dataset.
And regarding changes over time, not many people know whether the party leader’s rating is rising or falling. What matters is the party leader’s popularity (relative to that of their main opponent) at or shortly before the time of the election. People who are ‘satisfied’ with the party leader are more likely to be motivated to vote or to become active in the campaign.
For all of these reasons, I believe that the percentage ‘satisfied’ is a more direct measure of voting intention than either the index or the trend, and hence the best predictor of the outcome.
The 2010-2015 Parliament
So would it have made a difference if the election had been held at different time? (Of course, the Fixed-Term Parliament Act gave David Cameron no choice in 2015.) The graph below shows that Cameron’s personal ratings were ahead of Ed Miliband’s for most of the period.

Next election, I shall be watching party leader satisfaction ratings with close attention. Of course, this simple analysis can’t predict the numbers of votes or seats. But I find it interesting that the question ‘do you think X is doing a good job?’ may elicit a more accurate prediction of the ultimate winner than the more direct question ‘who do you intend to vote for?’.
Note: This article gives the views of the author, and not the position of the General Election blog, nor of the London School of Economics. Please read our comments policy before posting. It was originally featured on Ruth Dixon’s own blog.
Ruth Dixon has worked at the Department of Politics and International Relations at Oxford University since 2006.


1 Comments